Introduction
While political parties and politicians have reignited debate on immigration in recent years, economists are largely in agreement. Greater immigration flows have the potential to increase output by allowing workers to move to higher productivity countries. Economists generally find that immigrants’ gain in their new country does not come at the expense of natives’ economic success (Powell 2015). Like the free trade of goods, the free movement of people generally improves the lives of those involved in the exchange.
However, immigrants are more than inputs in a production function. They are also people who bring with them customs, norms, ideas, and habits. While some native residents fear the distributional effects of increased immigration and illegal immigration, others fear an increase in crime resulting from an influx of low-skilled immigrants from a distinct culture. Many are concerned about undocumented border crossings and the potential crime associated with those who enter and remain in the country unlawfully. Frustrated by a perceived lack of enforcement of immigration laws by the federal government, Arizona led several states in passing legislation that gave local law enforcement the authority to enforce federal immigration law.
In order to prevent crime that was believed to be associated with illegal immigration, in 2010 Arizona passed SB 1070, which extended immigration enforcement power to local law enforcement. Immediately after, other states began considering similar legislation modeled after Arizona’s law. While the debate primarily focused on whether the law treated individuals fairly or was a miscarriage of justice, the law’s effectiveness was frequently ignored in debate and analysis. Although parts of the Arizona law were declared unconstitutional by the Supreme Court, most of the provisions in the bill took effect in 2010.
The aim of this paper is to use a rational choice framework to explore the impact of Arizona’s SB 1070 legislation. Arizona had just passed an E-Verify law in 2007, making it difficult for unlawful residents to find work. Combined with the recession, this caused them to leave Arizona. SB 1070 may have helped continue this trend, reducing the crimes associated with unlawful residency. However, it also shifted policed resources away from other crimes, like murder or assault, to immigration related offenses. The recession forced Arizona to freeze hiring of law enforcement, which could have increased crime by decreasing the likelihood of a suspect being apprehended for committing a crime. Focusing the same resources on a greater array of crimes could reduce police effectiveness. In order to estimate the effect of SB 1070 on crime, it is important to understand the incentives and the change of opportunity costs facing individuals affected by the law.
I estimate the impact of SB 1070 on the crime rate in Arizona, both violent and property crimes, and their components. To accomplish this, I create a synthetic control for Arizona, comprised of a weighted average of other US states that matches important characteristics, to compare to Arizona. I use state and county-level difference in differences estimations to provide a further robustness check. I find that the implementation of SB 1070 was associated with an increase in violent crime, rape, and assaults, and a decrease in auto theft.
Literature Review
Research tends to find that immigration is associated with a reduction in crime. Martinez, Stowell, and Lee (2010) used a panel dataset of San Diego neighborhoods, finding that immigration was associated with a decrease, not an increase in violent crime. Adelman et al. (2017) investigated the relationship between immigration and crime across metropolitan areas from 1970 to 2010. Their findings suggest that the presence of immigrants leads to lower crime rates. Additionally, the presence of immigrants may lower natives’ crime rates (Sampson 2008). The positive effect of immigration into a neighborhood, which often includes reduced crime rates, is called “immigrant revitalization perspective” (Lee and Martinez 2002).
In contrast to the prevailing theories of crime, Gary Becker (1968) employed an economic analysis, using rational choice to understand individuals’ decisions to commit criminal acts. As the availability of data has improved, studies have been able to empirically test the model and provide evidence that the opportunity costs associated with criminal acts has an impact on individuals’ decision to commit crimes. Using a regression discontinuity, Pintotti (2015) found that immigrants in Italy who received legal status had a significantly lower rate of crime. As legal residents, they were able to work legal and better paying jobs, increasing the opportunity cost of committing crimes. In the United States, the mass legalization of illegal immigrants in 1987 by the Immigration Reform and Control Act (IRCA) reduced immigrants’ crime rate because of the greater opportunity costs of committing crimes (Baker 2015). However, while IRCA provided amnesty, it also increased work restrictions for other immigrant groups. Freedman, Owens, and Bohn (2018) found that crime rates increased for these groups relative to similar immigrant groups who had their working ability improved by IRCA.
A recent trend has been for states to enact policies to reduce illegal immigration on a more local level. The Secure Communities program, which began in 2008, was implemented in order to shift the enforcement of immigration to communities in the interior of the country. It entailed state and local law enforcement sharing information with federal authorities about the immigration status of arrested individuals. Treyger, Chalfin, and Loeffler (2014) found no effect of Secure Communities on crime or arrest patterns. Miles and Cox (2014) found that Secure Communities was associated with no change in violent crime or the FBI index crime rate. However, they did find evidence that the marginal immigrant criminals being deterred by Secure Communities were those who commit less serious crimes, rather than violent crimes.
The federal government also allows local law enforcement to partner with Immigration and Customs Enforcement through Section 287(g) of the Immigration and Nationality Act. Nowrasteh and Forrester (2018) studied the 287(g) program in North Carolina to estimate the impact of the controversial immigration law. Under 287(g), counties were able to opt into partnerships with federal immigration enforcement, providing a natural experiment. The authors found no evidence that 287(g) had an impact on crime or on police clearance rates, suggesting that shifting law enforcement resources to non-violent immigration offenses did not improve outcomes for communities. In Prince William County, Virginia, Koper et al. (2013) found that 287(g) did not have an impact on net crimes. They did find evidence of a decrease in assaults by 27 percent after the announcement of the program; but after implementation, the rate of assaults remained steady. These results suggest a combination of reduced offending, reduced victimization, and possibly reduced crime reporting by immigrants.
The state of Arizona implemented a broad E-Verify law in 2008 with significant fines for non-compliant firms. Chalfin and Deza (2020) estimate that, following the implementation of this law, the Mexican-born immigrant population fell by 20 percent as a result of the reduced opportunities for work. They found that property crimes decreased, which they believe was caused by the immigrants leaving; but they note that because the immigrant community is composed of more young, single males than the native population, the effect may be driven by demographics rather than immigration status. Similarly, Spenkuch (2014) finds that generally, Hispanic immigration is associated with higher crime rates. These findings provide evidence contrary to most studies on the effect of immigration on crime and show that in some circumstances, the effect of immigration is uncertain.
Immigration Law
In April 2010, Arizona passed SB 1070 and HB 2162 in order to address concerns over immigration enforcement, expanding the power of law enforcement (Archibold 2010). The law, commonly referred to as SB 1070, was intended to deter illegal immigration by adding a number of restrictions. The law would allow state and local law enforcement to work alongside or replace federal law enforcement and would mirror federal immigration laws. After the law was challenged, it took effect on July 29, 2010, although the district court barred four of the provisions.
The following four provisions in the original law were prevented from taking effect (Arizona Senate 2010). First, law enforcement would have been empowered to inquire immigration status at the time of a lawful stop, such as a traffic stop. A stop is considered lawful when law enforcement has reasonable suspicion that the individual has committed a crime. Noncitizens would have been required to carry registration documents and be ready to show them to law enforcement. Unauthorized aliens were to be prohibit- ed from applying for work, which would have made finding employment much more difficult. Finally, the law initially allowed for warrantless arrests if probable cause existed for an offense that would make the individual removable. All four of these provisions were blocked.
While the strongest provisions were not implemented, SB 1070 still strengthened Arizona’s immigration policy. The enacted provisions brought immigration-related offenses under the purview of local law enforcement. First, the law prohibits state and local law enforcement from restricting the enforcement of federal immigration law. Failure to report an immigration offense by any law enforcement officer or employee of a state agency would result in a class 2 misdemeanor. Law enforcement is required to verify with the federal government the immigration status of anyone arrested when there is reasonable suspicion that person is unlawfully present. That individual’s immigration status must be verified with the federal government before their release. It empowers legal residents to sue localities that refuse to adhere to the full enforcement of federal immigration law, and that jurisdiction is subject to civil penalties. No localities had decided to offer sanctuary status, so the lawsuits were not used. Any officer acting in good faith to enforce this law is indemnified against court-related expenses resulting from their enforcement of this law.
SB 1070 also makes it a crime to hire people along a street for work or to use a vehicle to pick them up along a street and transport them to work. Soliciting work in a public area is banned, whether seeking to work as an employee or an independent contractor. In order to deter human smuggling, the Arizona legislature added provisions prohibiting individuals from unlawfully transporting or harboring unlawful residents, making this a misdemeanor crime with a $1,000 fine. This misdemeanor crime becomes a felony if the number of unlawful residents involved is greater than 10, and the penalty is $1,000 per unlawful resident. It is a misdemeanor for individuals to encourage a foreign citizen to ignore proper channels when coming to the state, punishable with a $1,000 fine. Aiding and abetting unlawful residents already in the state is another misdemeanor with a $1,000 fine for citizens. These provisions have exemptions for Child Protective Services, First Responders, and Emergency Medical Technicians.
Employers caught attempting to hire an unlawful resident are allowed to use the affirmative defense that they were entrapped, but they are forced to admit considerable elements of the crime. Employers are further required to maintain records of employees’ legal residency verification for three years or the duration of employment, whichever is longer. Arizona also implemented a law in 2008 requiring businesses to use the E-Verify system in an attempt to prevent employers from hiring unlawful residents. Finally, SB 1070 directed the legislature to allocate funds towards the Gang and Immigration Intelligence Team Enforcement Mission (GIITEM), an organization whose mission is to reduce gang and illegal immigration-related crimes.
The day of its passage, Governor Jan Brewer issued a related executive order, instructing the Arizona Peace Officers Standards and Training Board to implement training for officers and agencies to begin enforcing SB 1070. Because of widespread concerns that the law would lead to racial profiling, the executive order also provided guidance to prevent racial profiling and protect civil rights while enforcing the law.
After Arizona passed SB 1070, five other states passed similar legislation involving local law enforcement with immigration enforcement. While states were able to pass these laws, most of the expanded powers of law enforcement were revoked by courts or settled. Alabama passed the most stringent law modeled after SB 1070 in the nation, in HB 56. Much of the law was blocked by the Eleventh Circuit Court of Appeals (Belczyk, 2011). In July 2011, Georgia implemented HB 87. The district court blocked the most controversial sections in 2012, but much of the law was implemented (Kowalski 2013). Indiana also implemented an immigration law, passing SB 590 in 2011. Soon after this law’s passage, a federal judge blocked key provisions (Evans 2013). South Carolina passed SB 20 in 2011. The law was blocked from implementation by a district court and the state eventually agreed to a settlement removing several provisions of the law in 2014 (Gomez 2014). Finally, Utah passed HB 497. The state settled a lawsuit, removing several provisions relating to the enforcement of the law (Fox13 2014).
Immigration and Crime
The belief that immigration is a cause of increased crime has historical roots and persists to this day (Fasani et al. 2019). Although they are driven in part by ethnic and racial prejudices, other theories have attempted to explain the apparent link. Crime rates were historically higher in areas that exhibited “social disorganization” (Shaw and McKay 1942), which explained why higher levels of immigrants, who tended to cluster in those neighborhoods, were associated with elevated crime rates.
However, evidence of social disorganization weakened over time and has been supplanted by immigration revitalization (Lee and Martinez 2002). A large proportion of immigrants are poor, single, young males (Orrenius and Zavodny 2019), a demographic who tends to commit crimes in higher rates than others (Snyder 2012). Yet empirical results typically find that immigrants commit fewer crimes than their native-born peers (Nowrasteh 2015). This suggests the possibility of a selection effect, whereby those who choose to immigrate are more ambitious than the average population. Leaving one’s country of birth, family, friends, language, and more to move to a new culture to start over requires high ambitions, determination, and a low time preference. In fact, modern areas of high crime tend to be ethnically homogeneous and disadvantaged, with few opportunities for success.
For my analysis, I employ a rational choice theory of crime (Becker 1968). The model was developed to understand the incentives that shape human behavior and the choice to commit criminal acts. Criminality depends on the relative costs and benefits of actions. Each individual rationally chooses between different alternatives.
In this model, an individual will choose to commit a crime when the marginal utility from the crime exceeds the marginal utility from any of an array of alternative actions—some legal, some illegal. The number of crimes is a function of the probability of conviction, the length of the sentence, and individual and local characteristics that can shape the individual’s utility function or expected punishments. Because apprehension and conviction is not certain, the probability of conviction affects the cost of the punishment. Increasing the probability of apprehension and conviction has the same effect of increasing the penalty for crimes. Authorities can try to increase the probability of apprehension and conviction or the severity of punishment to lower the crime rate.
The model implies that an increase in the probability of apprehension and conviction has a greater impact on crimes than an increase in the severity of the punishment. Even if the punishment were decreased to offset the increase in probability of apprehension and conviction, it should still reduce crime. While the expected cost of committing a criminal act remains the same, the amount of risk (the likelihood of being apprehended) increases, making crime less appealing to any risk-adverse individual.
Policymakers can improve the probability of apprehension and conviction through several measures. The adoption of improved technology and investigative techniques would help police gather more evidence and be able to use it to determine the identity of the criminal. Likewise, greater training for law enforcement should make them more effective at apprehending criminals and gathering evidence of crimes. They can also increase spending on law enforcement and hire more law enforcement officers, to increase the probability of apprehending individuals who commit crimes. Even simple measures like improved street lighting can reduce crime by increasing the likelihood of apprehension.
Furthermore, a change in the opportunity costs an individual faces will have an impact on their decision to commit crimes. For instance, better education will help improve the prospect for legal jobs. Better legal jobs will increase the opportunity cost of committing crimes. Both marriage and having children increase the costs of crime (Massenkoff and Rose 2020). Better housing or living in a better neighborhood can also increase the relative cost of arrest, thereby reducing an individual’s likelihood of committing crimes.
Lawmakers designed SB 1070 to reduce crime from illegal immigrants and from human traffickers. Provisions of the law were aimed at making illegal immigration more difficult; requiring police to inquire about immigration status at any lawful stop, verifying immigration status at arrest, and requiring immigrants to carry documentation at all times increased the probability of apprehending and deporting illegal immigrants. According to my model, this should reduce illegal immigration. Its effect on non-immigration offenses depends on the rate at which immigrants here illegally commit crimes compared to the native and legal immigrant populations.
However, some provisions of SB 1070 may have the opposite effect on the crime rate. By making it more difficult for illegal immigrants to apply for work and making it a crime to hire workers off the street, the law reduces the employment opportunities of immigrants. This would decrease the opportunity cost of committing crimes. The law also places penalties on citizens helping immigrants break immigration law. This would likely help worsen living conditions, again reducing the opportunity cost of crimes. Furthermore, because of the increased focus of law enforcement on immigration offenses, unlawful residents may be less likely to report crimes and act as police witnesses for fear of deportation. This will reduce the probability of detection and apprehension, making crime less costly for perpetrators.
Additionally, shifting the focus of law enforcement to immigration enforcement could increase crime. By empowering and incentivizing local law enforcement to focus on nonviolent immigration offenses, fewer resources may be available to focus on deterrence of violent crime. Native-born criminals will have a lower probability of apprehension and conviction, making crime relatively less costly for them. This reduced likelihood of being apprehended increases the expected benefit of illegal acts. Because the probability of arrest and punishment has a far greater impact than the duration of punishment on the decision to commit a crime, this reduction in likelihood of apprehension should have a substantial impact on the violent crime rate.
Combined, the Becker model of crime suggests an ambiguous effect of SB 1070 on crime. While the law will make crime costlier for some, it will make it relatively more beneficial for others, and may make crime either more or less costly for still others. This paper is an attempt to estimate the effect on crime of a law that makes undocumented entry more difficult.
Threats to Validity
The estimation strategy I rely upon rests on several assumptions. These include the exogeneity of the passage of SB 1070, the lack of other shocks to crime during the treatment period, and the ability to account for demographic spillovers as a result of this and other state and federal policies. In this section, I provide some evidence that these assumptions are likely to hold.
1. The Timing of SB 1070
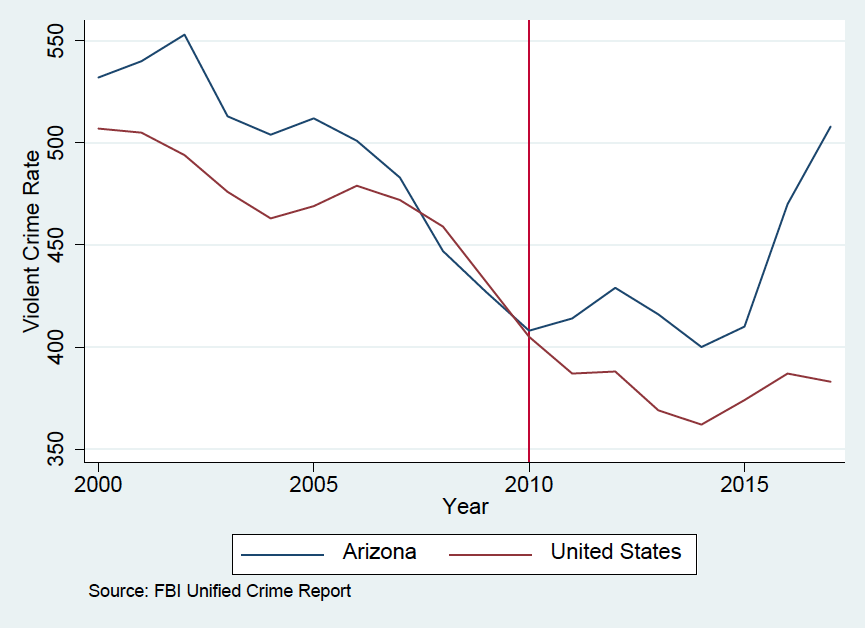
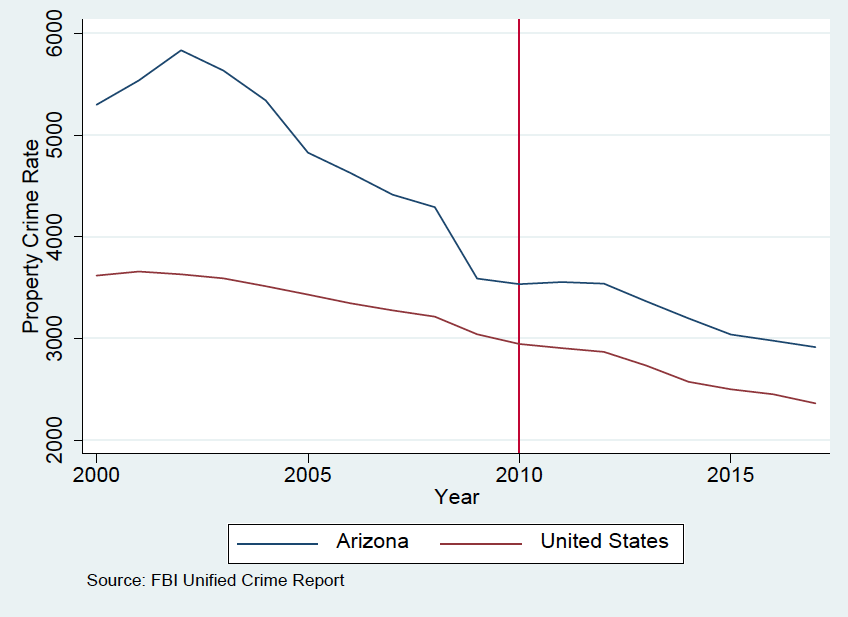
First, I assume that the passage of SB 1070 was exogenous, rather than being in response to any crime surge. As figures 1 and 2 show, violent crime and property crime rates were falling since 2000. The law was passed in response to unlawful residents being present in the state, and was an attempt to enforce immigration law through attrition. The stated goal of supporters of SB 1070 in the legislature was to support local law enforcement. The debate over an SB 1070 style law took place over several years. The Arizona legislature passed similar bills in 2006 and 2008, but both were vetoed by Governor Janet Napolitano (Archibald 2010).
2. The 2008 Recession
During most of the pretreatment period, the United States and Arizona experienced a period of economic growth. However, this ended in 2007 with the housing market bubble and subsequent recession. The recession began to affect the people of Arizona in 2008, just two years before SB 1070 was passed. An economic downturn with a high unemployment rate would have a profound impact on individuals and the decisions that they face. Unemployment decreases the opportunity cost and increases the relative benefit from committing a crime, according to the Becker model. Therefore, one would expect to experience an increase in crime during a recession, especially income-producing property crimes; this is in line with past findings (Freedman, Owens, and Bohn 2018; Pinnotti 2017).
To control for effects of the recession, I include covariates for the unemployment rate, per capita income, and the share of workers in construction employment. Because of the decrease in housing prices during the recession and its effect on the construction industry, Arizona was particularly impacted by the recession. For my synthetic control estimations, I use these covariates as matching variables, to ensure that my synthetic control estimates take into account the effect of the recession on the labor market.
3. Changes in Arizona Immigration Enforcement
An additional concern is that within Arizona, there were other changes to immigration policy that could affect crime along with SB 1070. The first is the passage of the Legal Arizona Workers Act (LAWA), which was passed in 2007 and implemented on January 1, 2008. Under LAWA, employers must verify the work eligibility of new hires against federal databases to ensure that workers have legal residency status.
Research has found that LAWA was associated with a 20 percent decrease in the non-citizen Hispanic population of Arizona (Chalfin and Deza 2020). Chalfin and Deza find that the reduction in the Hispan- ic non-citizen population is associated with a decrease in property crimes. LAWA was implemented two and half years before SB 1070 was implemented, so the two laws should have separate effects, but LAWA may have exhausted the ability of law enforcement to reduce crime in the state. This effect would hamper the external validity of the model for states that did not pass E-Verify laws in the years before passing an SB 1070-style immigration enforcement law. While the model may not be able to accurately estimate the effect of another state passing a law similar to SB 1070, it still provides evidence of the effect of the law in Arizona.
Another concern for immigration enforcement within Arizona is Maricopa County. The Sheriff of Maricopa County is Joe Arpaio, who has branded himself the toughest sheriff in the country and strictly enforces immigration laws. While Arpaio has been outspoken about immigration enforcement, Chalfin and Deza (2020) note that it appears that Arpaio began increased immigration enforcement after the 2005 local election in which immigration enforcement played a key role. He did not begin any new immigration initiatives in the lead up to or immediate aftermath of SB 1070.
4. Federal Immigration Enforcement Changes
While state-level immigration enforcement policies have been newsworthy, much of the immigration enforcement is still done by the federal government. Any major change in federal immigration policy that coincides with the implementation of SB 1070 could pose problems for my estimation. Bohn, Lofstrom, and Raphael (2014) reviewed Department of Homeland Security arrest and apprehension reports. They found no evidence that the federal government escalated enforcement or arrests in the Tucson border area in the lead up to SB 1070’s passage.
President Obama signed an executive order titled Deferred Action for Childhood Arrivals (DACA) in 2012. DACA provided renewable two-year grants of protection from deportation for unlawful residents who arrived as children (Fiflis 2013). In order to be eligible for DACA, an individual must not have a criminal record. DACA was not implemented until two years after the implementation of SB 1070 and should have a negative effect on crime for those who are able to avoid deportation. Although the administration tried to extend the protections to parents of children who are US citizens, this initiative was blocked from taking effect.
Another area of concern is the implementation of the Secure Communities program by the Immigration and Customs Enforcement (ICE) and local law enforcement agencies. Under Secure Communities, local law enforcement is required to send identifying information to ICE so that unlawful residents can be identified and deported by the federal law enforcement. Many Arizona counties—including the most populous counties—enrolled in Secure Communities in 2009, just a year and a half before SB 1070. By the end of 2012, ICE identified nearly 85,000 alien arrestees in Arizona. However, relatively few had actually been removed, and past research has found little effect on crime (Miles and Cox 2014 Treyger, Chalfin, and Loeffler 2014). Despite these findings suggesting no effect of Secure Communities, it is impossible to entirely rule out the impact of the policy along with SB 1070.
Data
I developed a panel of data for 48 US states over 18 years. The data for crime rates in the United States for violent crime for the period 2000 through 2017 came from the Uniform Crime Reports (UCR) compiled by the Federal Bureau of Investigation (United States Department of Justice). The UCR collects statistics related to crime and law enforcement from more than 18,000 city, university and college, county, state, tribal, and federal law enforcement agencies that voluntarily participate in the program. The UCR data rely on voluntary participation by local law enforcement, suffer from differences in the definitions of crimes across localities and states, and are limited by the non-reporting of crimes by victims. Despite these shortcomings, the UCR remains the best source of geographically disaggregated crime data available in the United States. The UCR breaks down the crime rate into violent and property crimes, and both of those by crime type. Violent crimes include murder, rape, robbery, and assault. Property crimes include burglary, larceny, and auto theft.
My dependent variable will be the natural log of the crime rate, or the number of crimes per 100,000 residents. I will use the natural log of the violent crime rate and property crime rate, and each of the crimes that comprise them. Figures 1 and 2 in the appendix show the violent crime rate and property crime rate for the United States compared to the state of Arizona. These graphs show that Arizona had much higher rates of violent crime than the rest of the United States throughout much of the sample period. The violent crime rate in Arizona fell to match the US rate but then diverged in 2010 to a higher rate. Arizona had a higher property crime rate than the United States, and while both fell during the sample period, Arizona’s fell more sharply. Arizona’s property crime rate stabilized after 2010 for a few years before resuming its decrease.
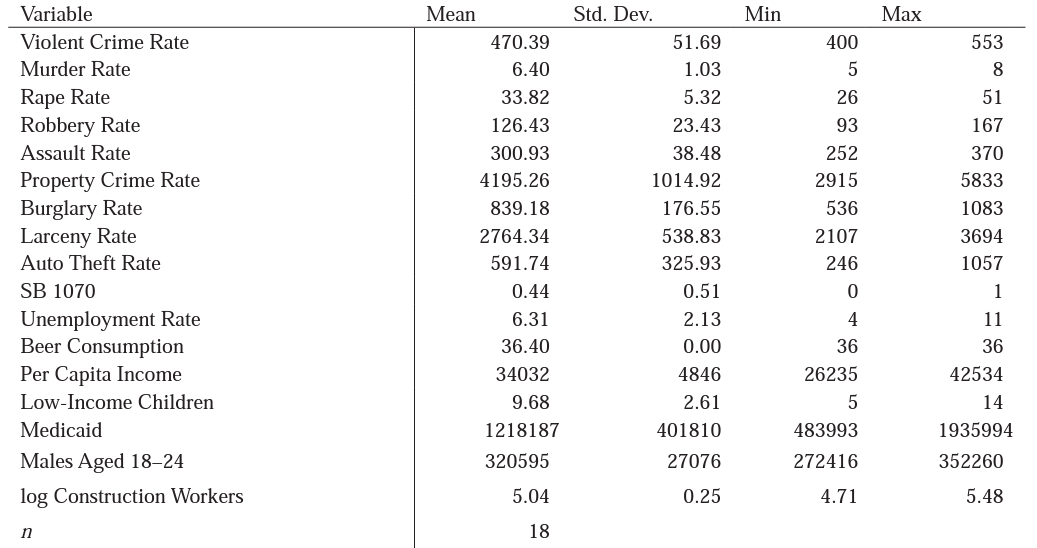
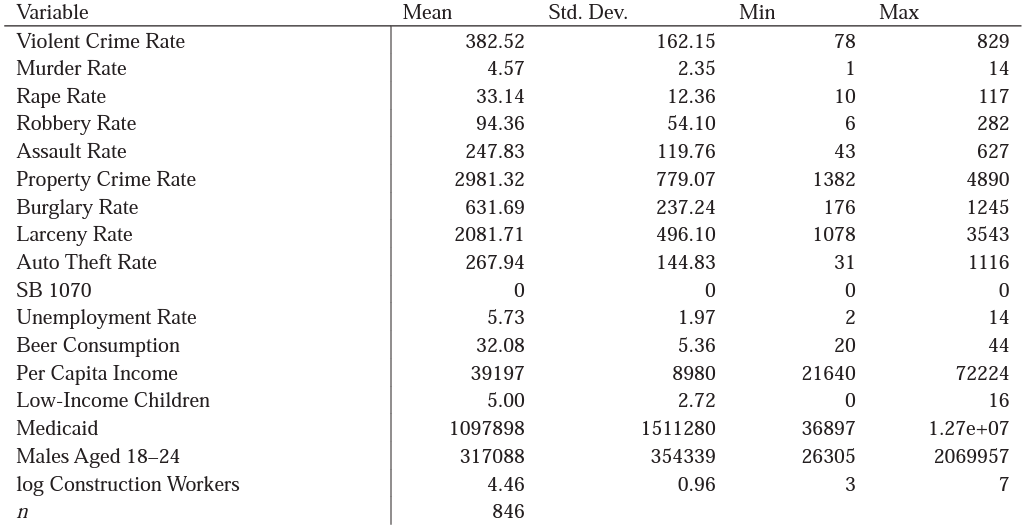
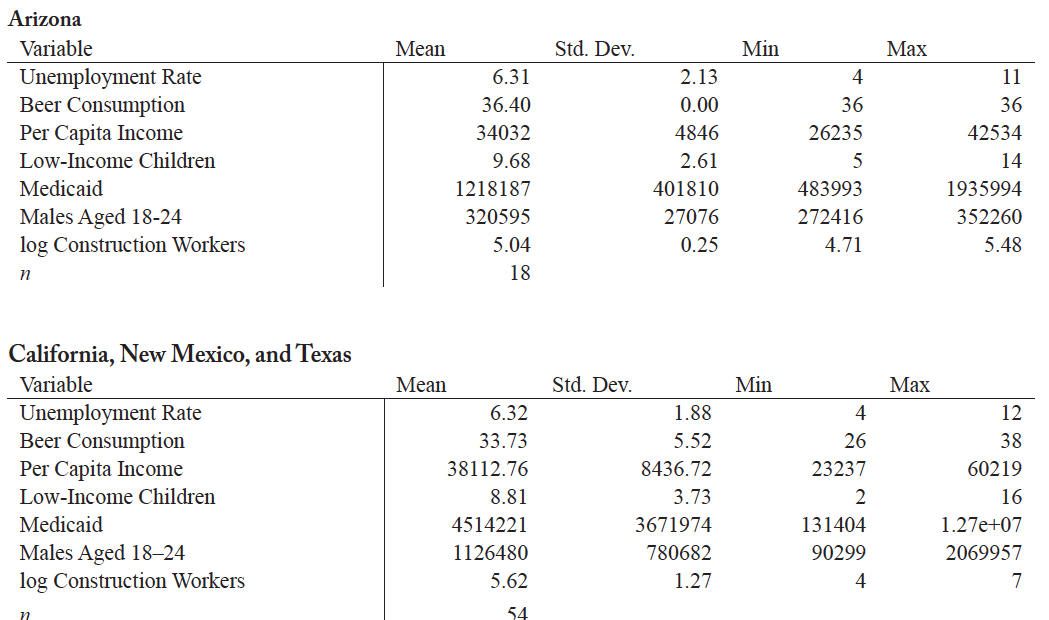
I included time and state varying covariates in order to control for differing conditions between states or over time that impact crime. Together, these variables should measure the conditions that are associated with crime. For my control variables, data came from multiple sources. For the state unemployment rate, the data came from FRED, the Federal Reserve Bank of St. Louis Economic Database. The variable beer consumption per capita came from the Beer Institute. Greater consumption of alcohol could also be associated with higher crime (Donohue and Levitt 2001). For a measure of per capita income, I used per capita income by state from the Bureau of Economic Analysis (BEA 2017). I collected poverty variables from the UKCPR National Welfare Data, which included the percentage of low-income children (UKCPR 2018). In order to control for the number of young males (the demographic with the highest offending rate), I included the number of males between 18 and 24 years old, from the US census intercensal demographic tables. While the per capita income and the unemployment rate would capture much of the effect of the 2007–2008 recession and the subsequent slow recovery, the recession had a disparate impact across industries that cannot fully be captured by per capita income. I also included the natural log of the number of workers employed in the construction industry, which came from the Bureau of Labor Statistics (BLS 2020). Because the BLS does not have data for Delaware, the District of Columbia, or Hawaii, I excluded these states from my sample. I included the percentage of the state population of Hispanic origin, accessed from the US Census Bureau State Characteristics Population Estimates (US Census 2020). The summary statistics for Arizona compared to the rest of the United States can be found in table 1 and table 2 in the appendix.
Estimation Strategy
Performing a difference in differences estimation with the three other southern border states as a control group presents some potential problems (Abadie et al. 2010). There is concern that the characteristics of the control states in the case study do not match the treatment group—that the controls do not present an accurate counterfactual. Perfect reproduction is extremely difficult, and knowing just how closely the control matches is difficult as well. This approach is likely to produce biased estimates if time-varying differences in underlying characteristics of the states are present. For this reason, studies that employ a difference in differences (DID) estimation use several states as treatment and control states. In this case, I am uncertain whether these states can control for the differences in the laws, immigration flows, and characteristics of the immigrants they attract, and the characteristics of the residents. The covariates for the border state subsample are similar to Arizona; however, they are not a perfect counterfactual for Arizona, as shown in table 7, which presents some concern for my estimates.
While I could expand my control to include more states in order to attempt to reduce the differences between the treatment and control, this presents another concern. Using inferential techniques that require large sample sizes are not appropriate for studies when the treatment sample is substantially smaller. Typically, studies that estimate the impact of state-level policy changes take advantage of policy differences across states, providing a quasi-natural experiment to study. In this case, SB 1070 was only enacted for 8 of the 864 observations in the sample. Using the entire United States as a control group would not yield accurate results, and because only one state passed and implemented this type of law, it could not be considered a natural experiment.
Using the county-level data can solve some of these problems, but this approach still suffers from shortcomings. The counties of Arizona do have some observable differences, but they are still all in one state, with state-level law spillovers across county economies. Because the treatment only takes place in one state, it is difficult to consider it a natural experiment. Therefore, I employ the synthetic control method (SCM) to construct a better comparison to measure against Arizona.
Synthetic Control
1. Model
In order to estimate the impact of SB 1070 on violent crime and to check the robustness of the results, I used the SCM to create a control state to use as a comparison for this case study. This method involves taking a weighted average of potential control states in order to estimate a control state whose characteristics more closely match the treatment state. The algorithm uses the data to identify a group of states that, combined, can match the characteristics of Arizona. This combination of states can be used as a counterfactual Arizona, as if Arizona never implemented SB 1070. The created control state reproduces the values of a set of predictors of the crime rate before SB 1070 went into effect. The crime rate for synthetic Arizona should match the crime rate for real Arizona as closely as possible until the treatment period, which is 2010 when SB 1070 was implemented. The synthetic Arizona should continue the trend that Arizona would have taken had it not been for the passage of SB 1070. Any divergence of Arizona from the synthetic trend provides evidence in favor of the law having an impact on violent crime.
For SCM to be an appropriate method to estimate the impact of SB 1070, three assumptions must be met. First, only the treated state can implement the policy, and its effect cannot spill over into other states. Arizona was the only state to enact SB 1070; I exclude Georgia, which implemented a policy containing some of SB 1070’s provisions. I did allow the other states that passed similar immigration laws to be included in the sample because lawsuits prevented those laws from being implemented. Additionally, SB 1070 had no effect on other jurisdictions. It was not enforceable in other states and did not cause law enforcement to change their allocation of attention or resources to immigration enforcement. Second, there can be no effect of the legislation before implementation. This assumption holds again, as police could not enforce this rule prior to the effective date. Finally, the synthetic control state must be comprised of a fixed combination of donor states that are similar to the treatment state, or the estimation will suffer from interpolation bias.1The relationship between the outcome variable and the matching variable should be relatively linear. If they are not linearly related, the donor states selected must have similar characteristics, or the estimate will be biased. For instance, if Arizona were 75 percent white and 25 percent nonwhite, it would approximate the combination of a state that was 65 percent white and 35 percent nonwhite with a state that was 85 percent white and 15 percent nonwhite, if that outcome is approximately linear in the racial composition of the states. However, if the outcome is highly nonlinear across racial compositions, the quality of the approximation may be poor and the interpolation between the racial compositions would produce biased results. The states included in this sample share similarities with Arizona.
Because crime can be broken down into violent and property, and further divided into seven subcategories, this study will include all nine measures of crime. I will estimate separate synthetic controls for each crime using the natural log of the crime rate as the dependent variable. I will test violent crime, murder, rape, robbery, assault, property crime, burglary, larceny, and auto theft.
For my SCM estimations, I excluded Georgia because its passage and implementation of similar legislation made it an unsuitable control. I also excluded Delaware, the District of Columbia, and Hawaii because the BLS did not have data on construction employment for those states. For the matching variables I used the unemployment rate, beer consumption, income per capita, low-income uninsured children per capita, males aged 18 to 24, log construction employment, and the crime rate for each year in the pre-treatment period. I estimated a different synthetic control for each crime rate. A formal description of the empirical model for SCM can be found in the appendix.
2. Results
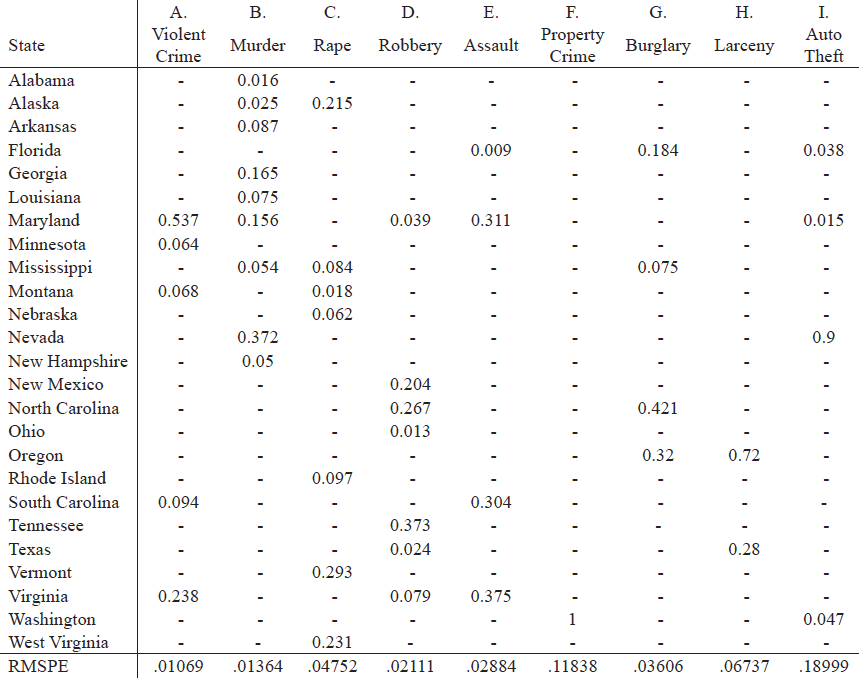
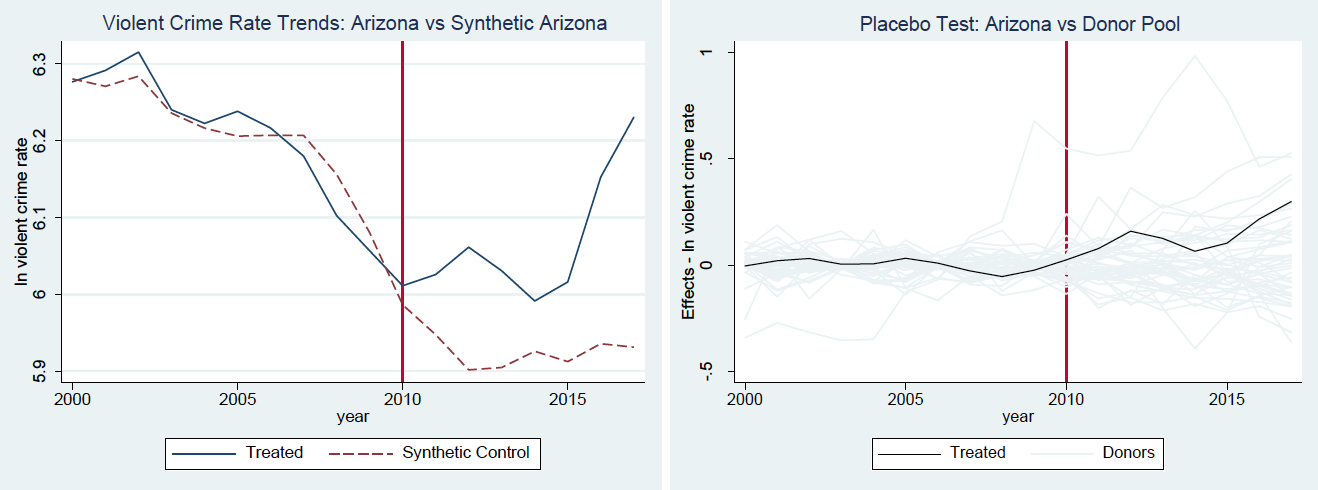
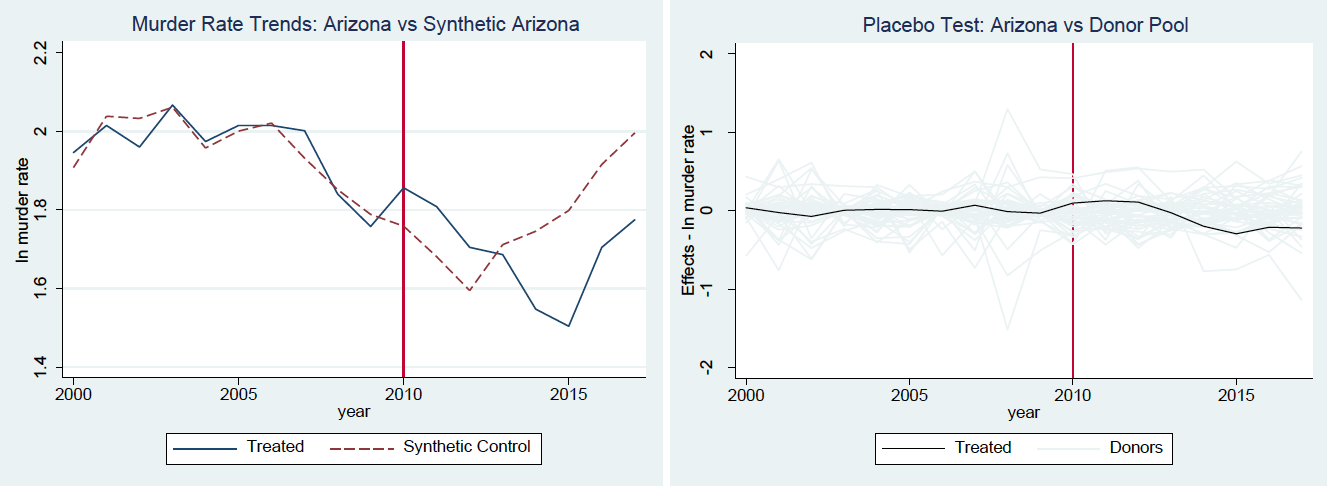
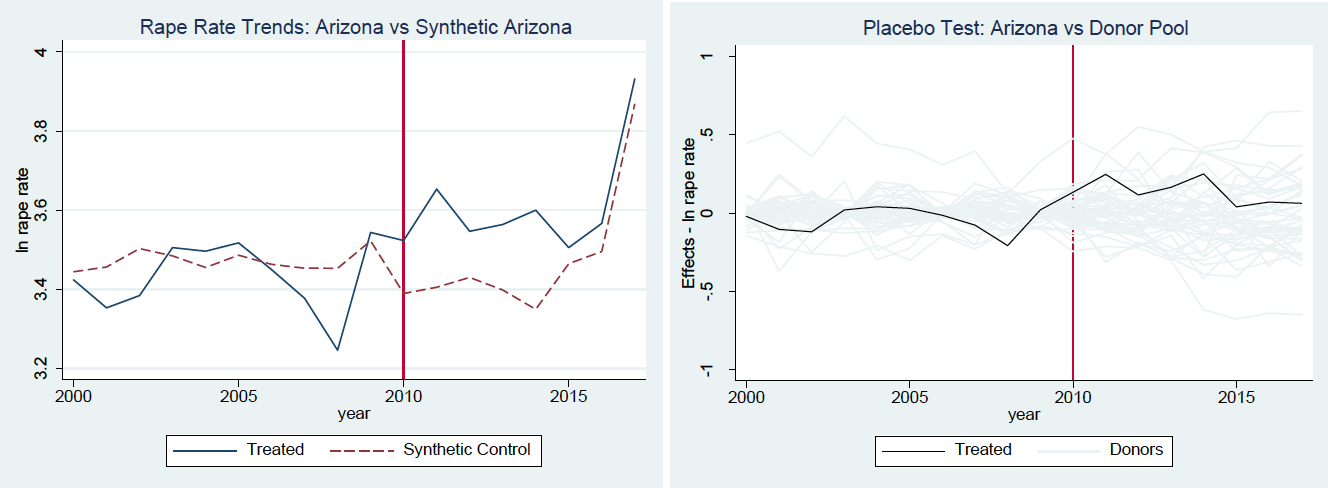
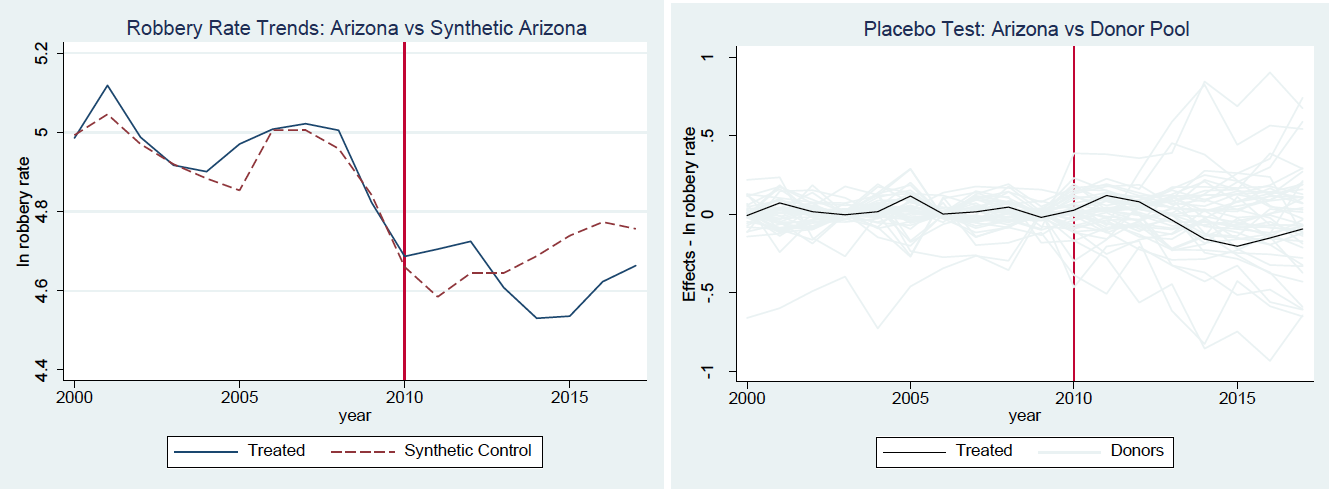
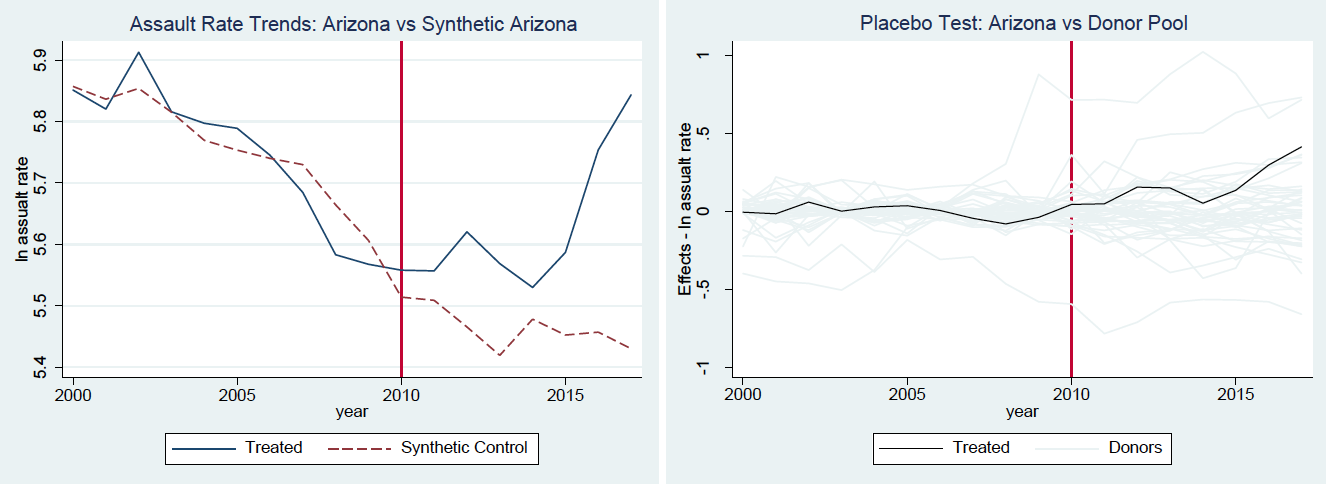
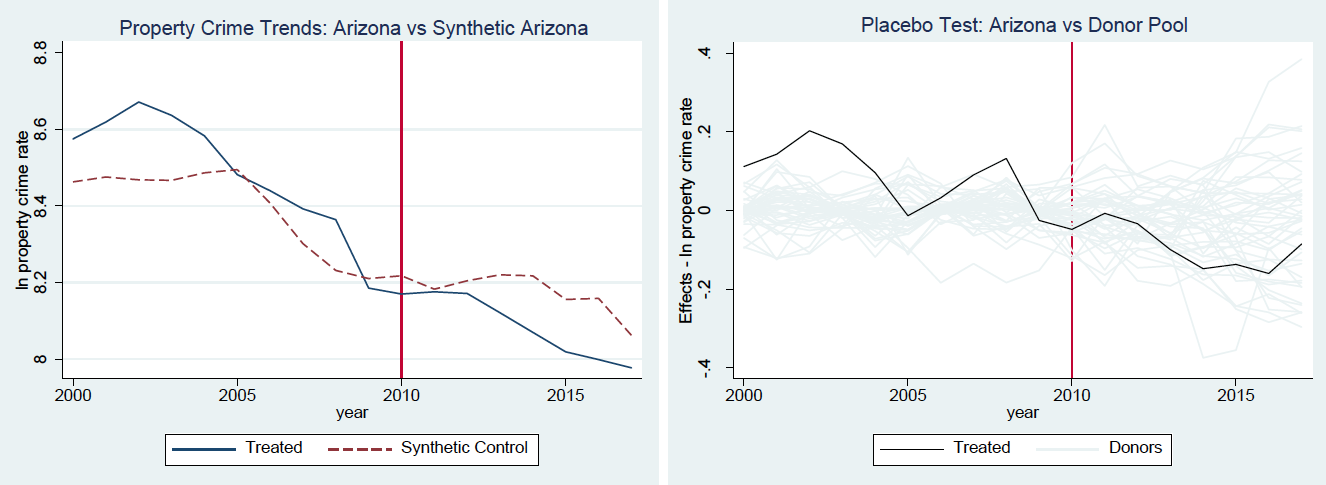
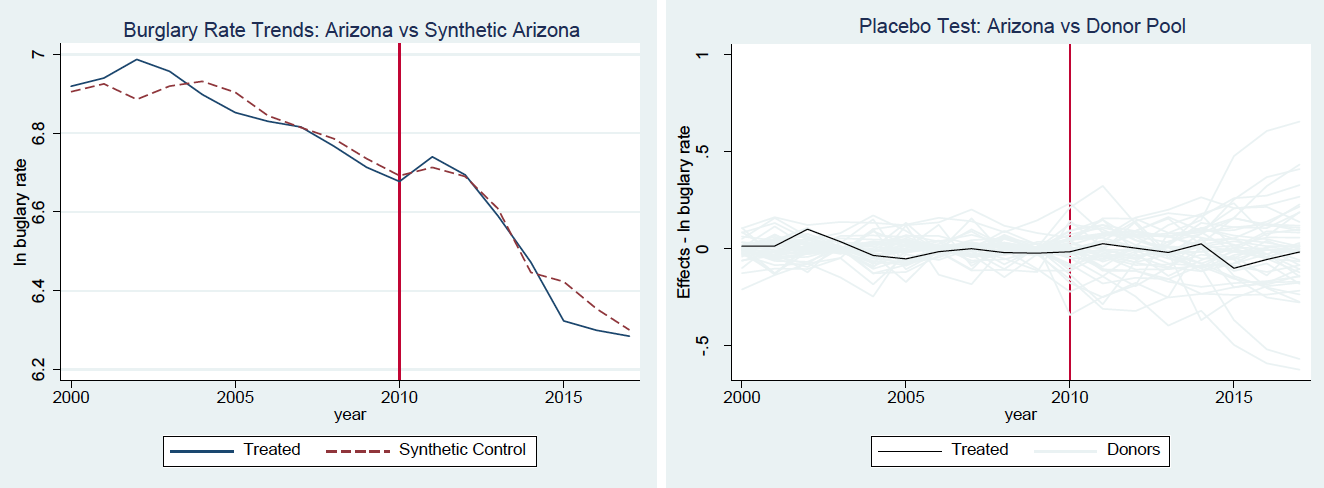
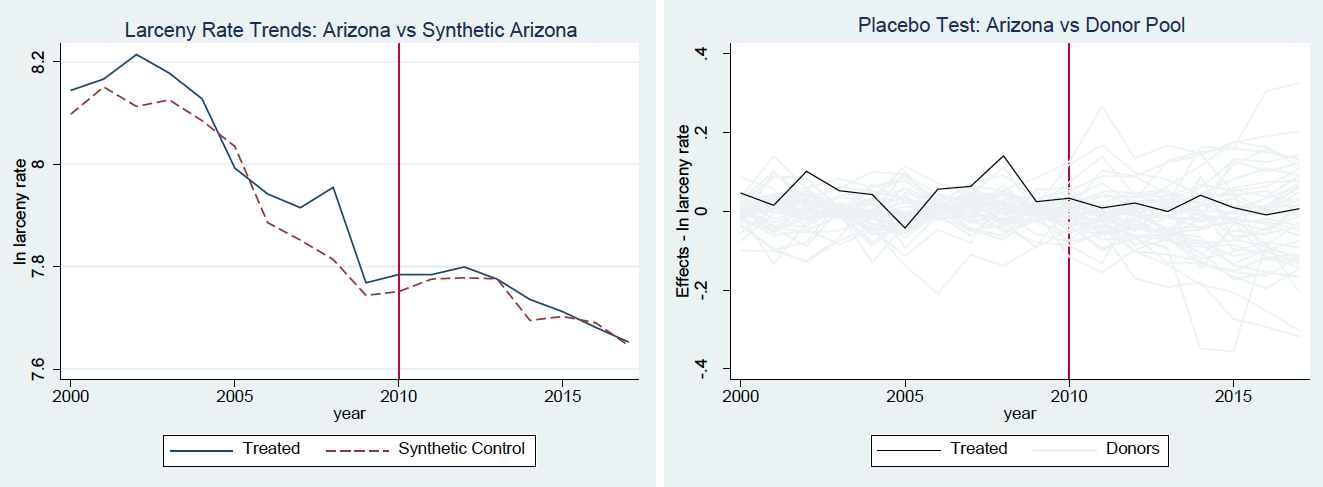
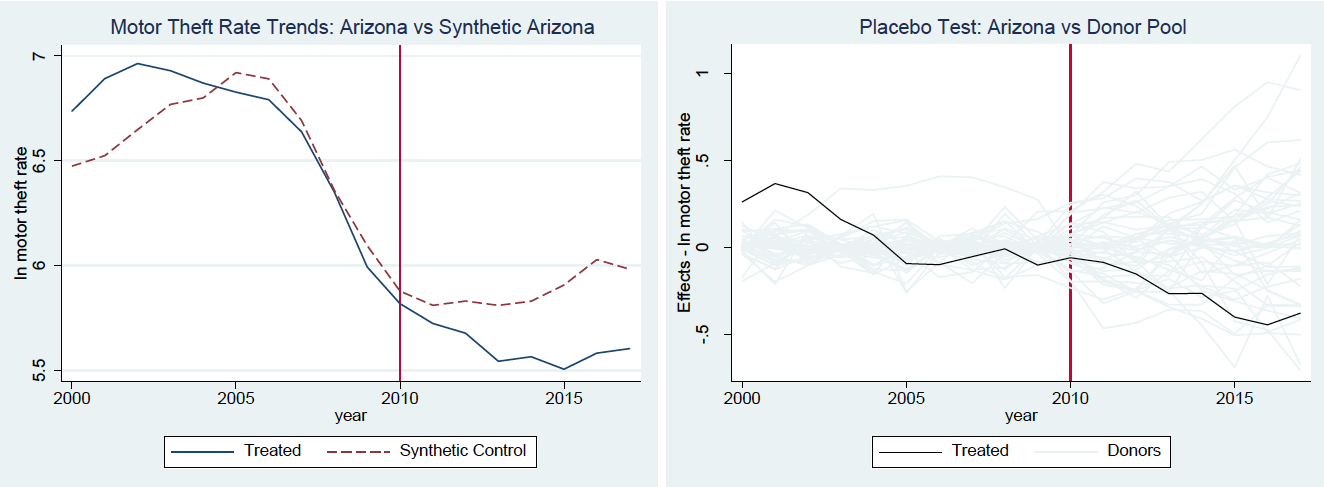
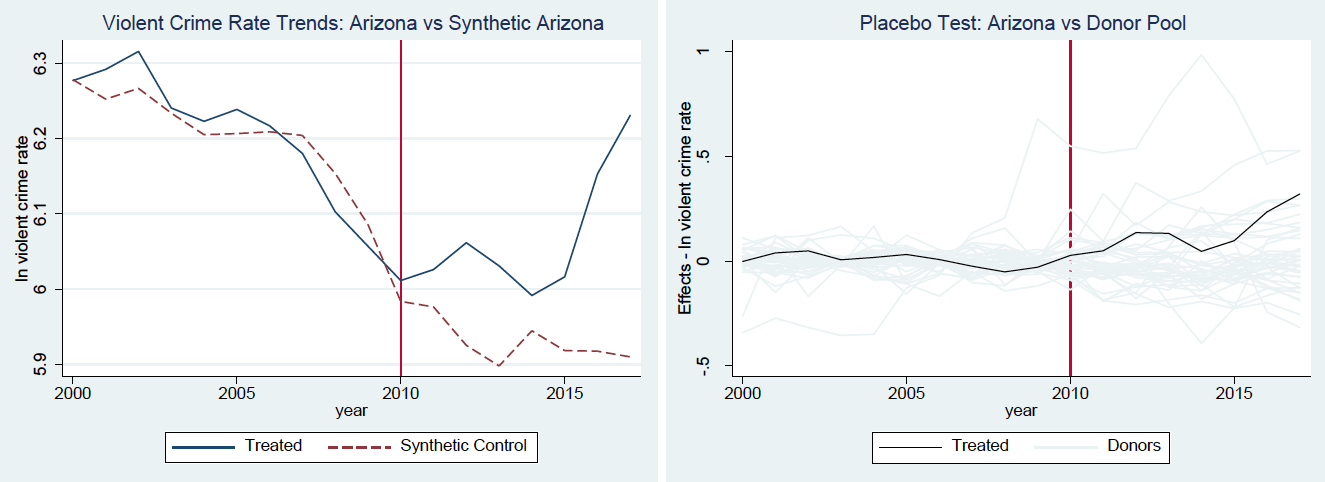
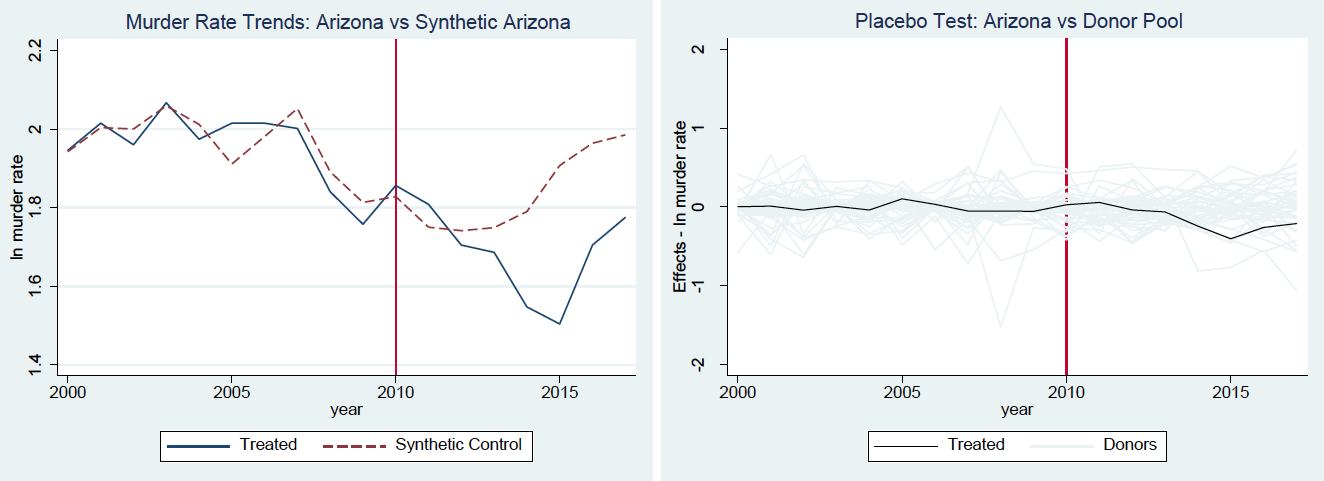
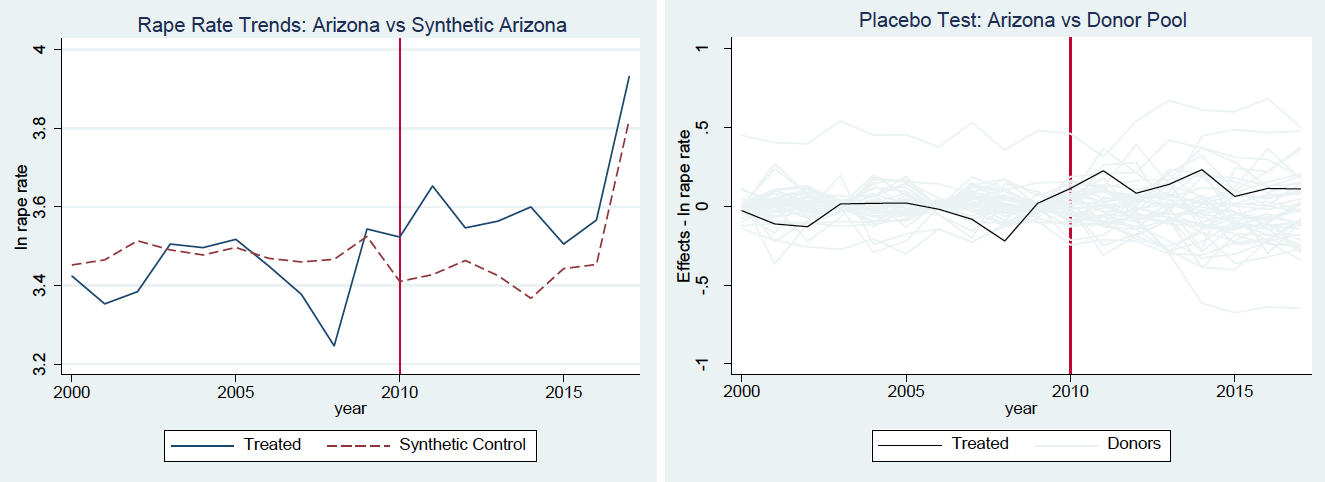
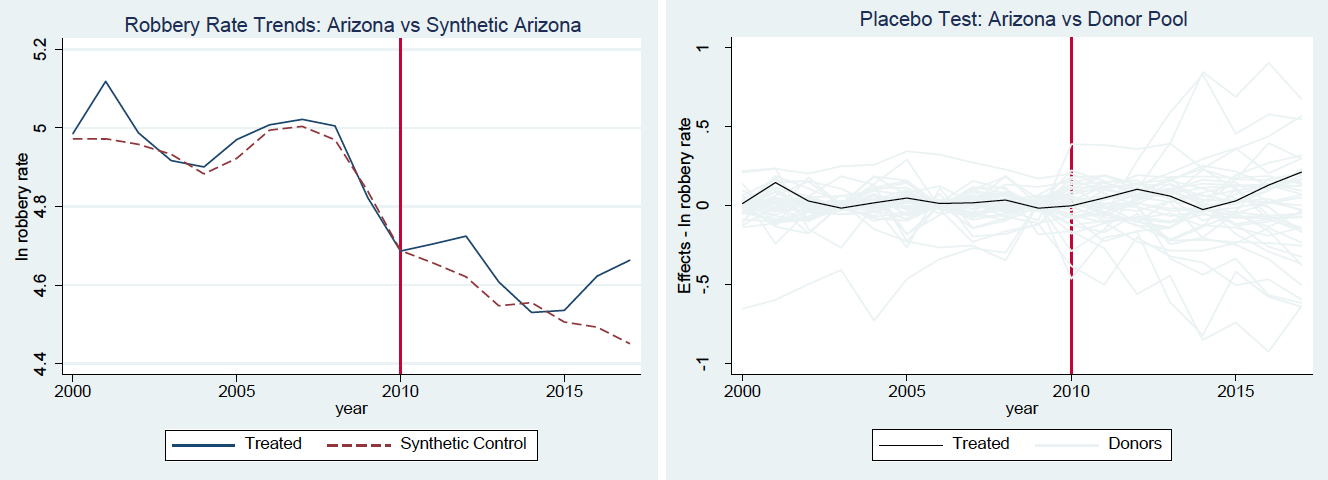
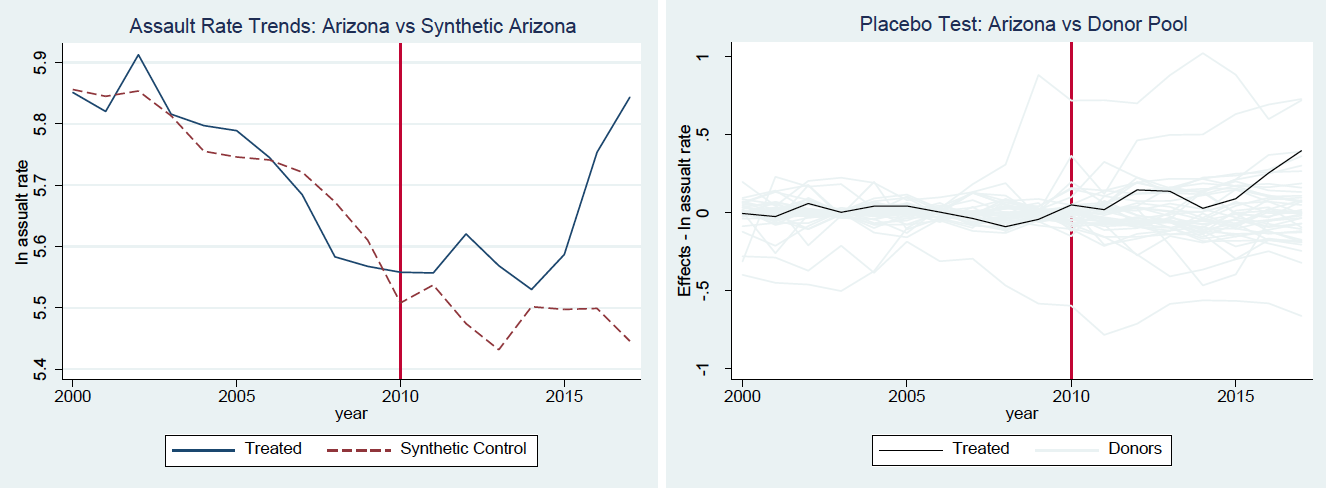
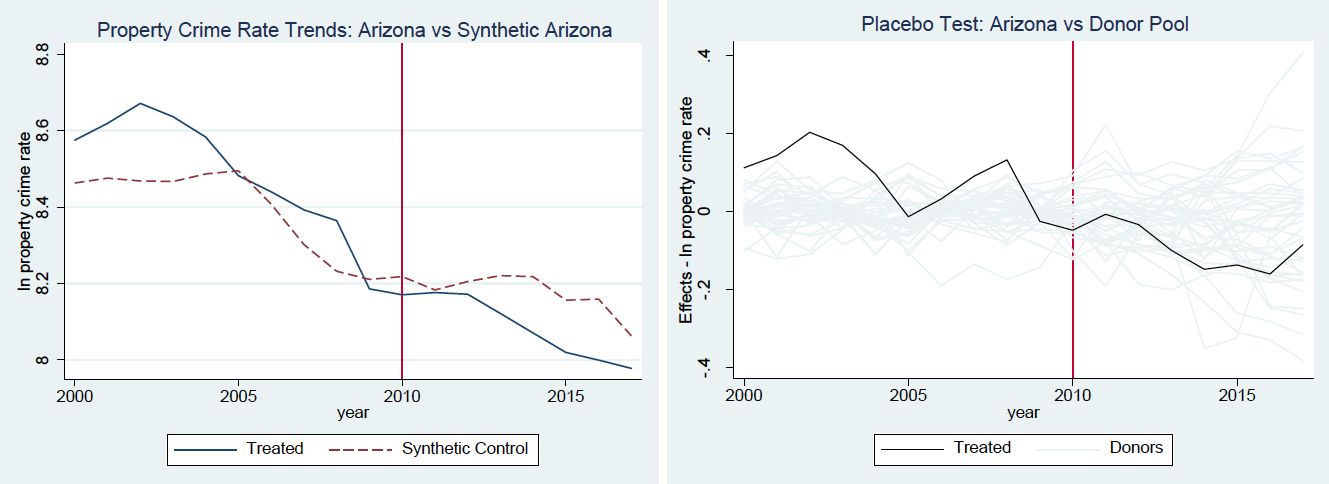
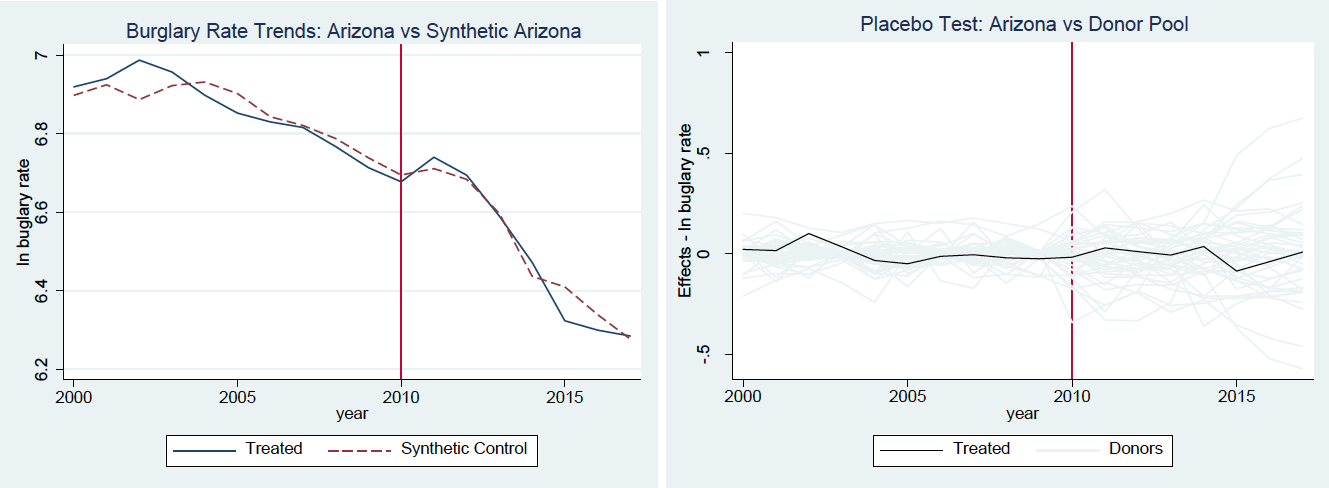
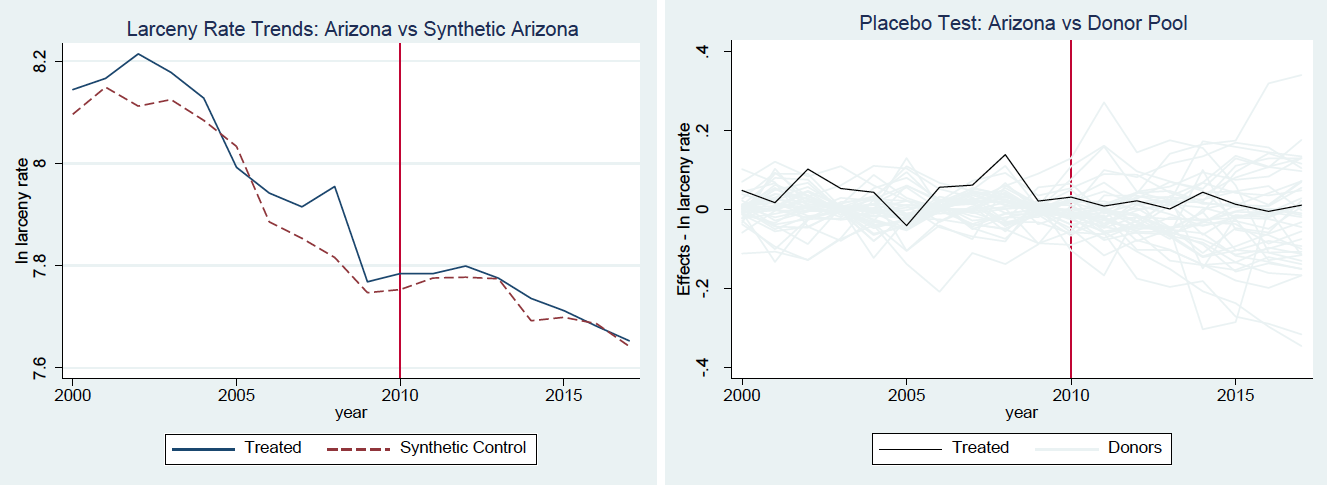
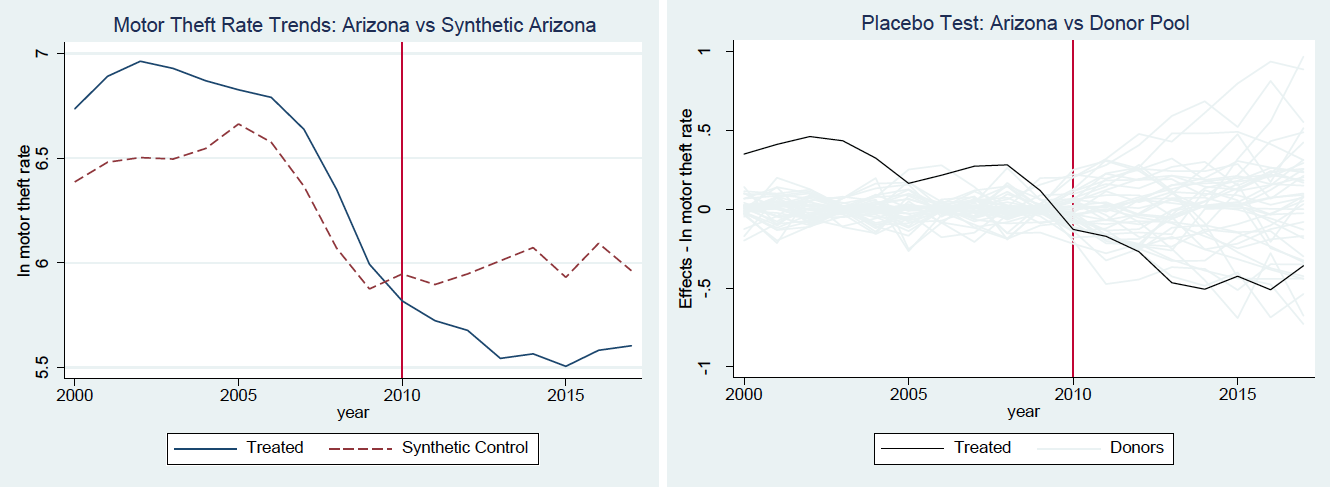
Figure 3 presents a series of graphs for the synthetic control estimations for each type of crime. Each panel includes a synthetic DID estimate comparing the trend in Arizona to a synthetic Arizona, an estimate of the difference between Arizona and the synthetic Arizona, a placebo test with the donor states, and a graph of the estimated values by year. Panel A presents the results for violent crime. For violent crime, the synthetic Arizona was comprised of five states selected from a donor pool of 47 states, shown in table 8. The violent crime trends in Arizona are best replicated by the five states in the synthetic Arizona; all other states received a weight of 0 from the estimation.
Synthetic Arizona is an appropriate control group because the pretreatment trends for Arizona and synthetic Arizona are similar. For the nine pretreatment years, the synthetic Arizona accurately reproduces the observed Arizona violent crime rate. Figure 3 compares the trends for the violent crime rate in Arizona and synthetic Arizona over the sample period. The root mean squared predictor error (RMSPE) measures the gap in the outcome variable of interest between the treatment state and synthetic control and is reported for each model in the last low of table 8.
An estimate of the impact of SB 1070 on the violent crime rate can be illustrated by the divergence between the trend lines for Arizona and synthetic Arizona. There is a deviation after the implementation of SB 1070 in 2010 between Arizona and synthetic Arizona. If there was no effect of the legislation, one would observe no divergence between the two lines. The violent crime rate in Arizona fell until 2010, remained flat for five years, and began to increase in 2015. However, in synthetic Arizona the violent crime rate continued to fall until 2015. This provides some evidence that SB 1070 had a positive association with the violent crime rate.
I also plot the difference in the violent crime rate between Arizona and synthetic Arizona. This shows that after the implementation of SB 1070, the violent crime rate increased relative to the synthetic control. The difference between Arizona and synthetic Arizona was between 10 and 30 percent. The results suggest that from 2010 to 2017, there is evidence that SB 1070 was associated with an increase in the violent crime rate of around 20 percent.
To ensure that the results were not driven by random chance, I report an estimate of the values for synthetic Arizona. I plot the
value for each year after the treatment period. I used two-tailed tests with the null hypothesis that the placebo states would experience an effect at least as large (in absolute-value terms) as the estimated effect in Arizona to compute the
values . Only the years 2 through 4 had statistical significance. Because of the lack of statistical significance in later years, I am unable to confirm the largest effects of SB 1070. However, it does provide some evidence of an increase in violent crime in the first few years after the implementation of SB 1070.
I also performed a series of robustness checks. To test the model, I compared the other states in the donor pool to synthetic Arizona. I applied the SCM to states that did not impose SB 1070, simulating as if each state implemented SB 1070 in 2010. If the placebo states followed the same trend as Arizona, it would suggest that my model does not provide evidence of an effect on the violent crime rate. Arizona is represented by the thick black line, and the other 47 states are represented by the lighter gray lines. As the graph shows, the Arizona estimation lies near the top of the range of estimations.
I also test the effect of SB 1070 on the components of violent crime individually. Panels B through E display the estimations for the murder rate, rape rate, robbery rate, and aggravated assault rate for Arizona and synthetic Arizona. The figures for both estimates provide evidence of an increase in the murder and robbery rates in the first three years after the implementation of SB 1070. However, this result flips after year 3, and in subsequent years it appears to reduce crime in Arizona compared to synthetic Arizona. The values for the murder rate are weakly statistically significant, with a
value of around 0.10 for only three of the years after the treatment. For the robbery rate, the
values never approach 0.10 for any year. The placebo tests confirm these results with several states having a greater estimated deviation from synthetic Arizona.
The trends for Arizona and synthetic Arizona diverge after the treatment in 2010 for aggravated assault. The observations for the aggravated assault rate in Arizona are around 10 percent higher than the estimated synthetic Arizona. The values for synthetic Arizona are weakly significant for the assault rate, and four of the eight pretreatment years are between 0.05 and 0.10. In the placebo test, the synthetic Arizona estimation lies near the top of the states on the placebo graph.
For the rape rate, the estimated trends for synthetic Arizona and Arizona diverge from 2010 until 2015. The rape rate in Arizona increased by around 20 percent compared to synthetic Arizona. None of the values for any period are significant for the estimation of the rape rate. In the placebo tests, Arizona was a state with one of the largest increases after 2010.
There is weaker evidence of SB 1070 having an effect on property crimes in Arizona. Panel F displays the property crime. While it shows that property crimes fell, the model is poorly fit because Arizona had one of the highest crime rates in the pretreatment period. Burglary and larceny had a better fit, and these estimates do not provide evidence that SB 1070 was associated with a change in the crime rate. Finally, the estimate for auto theft was poorly fit in the pretreatment period. Although the post-treatment period showed a decrease in auto theft, it was not statistically significant.
3. Robustness Checks
I perform robustness checks of the synthetic control estimations in the previous section to test if they are sensitive to the specifics of the model. I begin by re-specifying the SCM with a reduced donor pool of states. I removed the neighboring states of California, New Mexico, Nevada, and Utah. These estimates should remove the potential bias caused by spillover from Arizona to its neighboring states after the passage of SB 1070. If the immigrants left Arizona for the neighboring states, the estimated impact of SB 1070 will be too high. Figure 4 compares the trend line for Arizona and synthetic Arizona and a placebo test with the donor states for each type of crime. Because the bordering states were so rarely included in the synthetic controls for the initial models, the robustness check only has a slight difference. The only measure of crime with a notable change was the murder rate. When excluding the neighboring states, the murder rate was reduced further. The results of the robustness test suggest that cross-border spillovers from SB 1070 do not have a measurable impact on the estimated effect and supports the estimates presented in figure 3.
In order to test this model’s sensitivity to the matching variables included, I performed another test, dropping Medicaid, low-income children, and beer consumption as control variables. I found that the estimated effect of SB 1070 did not substantially differ from my previous models, which can be provided upon request.
In addition to alternative specifications of synthetic controls, I also estimate DID models at the state level. While there is concern that the neighboring states are not a suitable control for Arizona, finding results that are consistent with the SCM estimations would provide evidence to strengthen those results. I estimated the effects of Arizona SB 1070 on the natural log of the crime rate with the following equation:
(1)
where is a dummy variable representing the imposition of Arizona SB 1070, coded 0 if the law was not in effect and 1 if the law was in effect.
is a vector of state control variables. These include the states’ unemployment rate, income per capita, beer consumption, low-income uninsured children per capita, the number of males aged 18 to 24, the natural log of the number of workers employed in the construction industry, and the percentage of the state population of Hispanic origin.
is a vector of state fixed effects and
is a vector of time fixed effects.
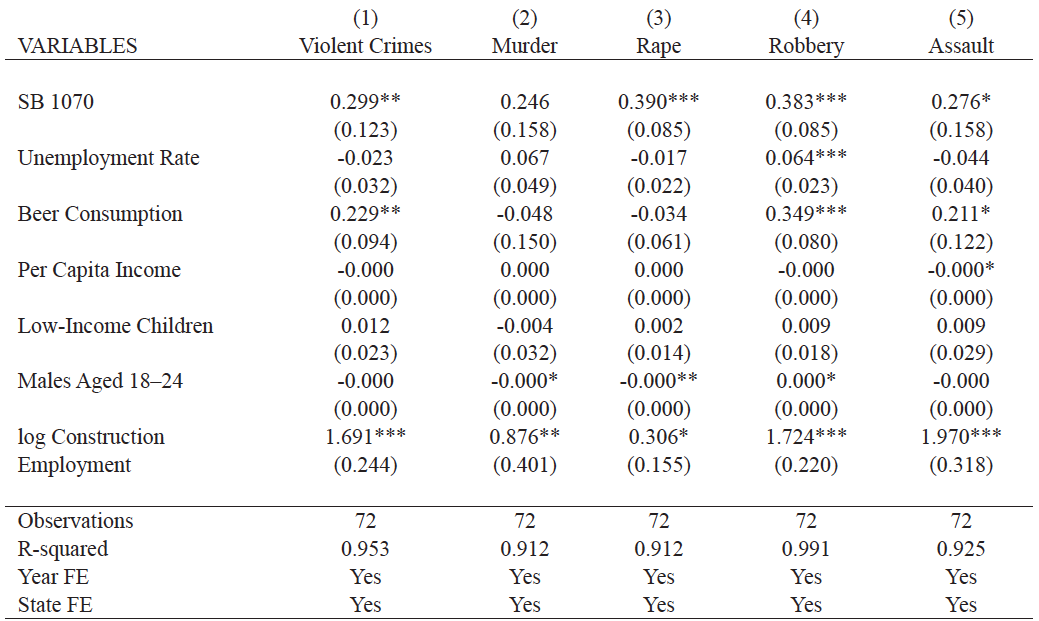
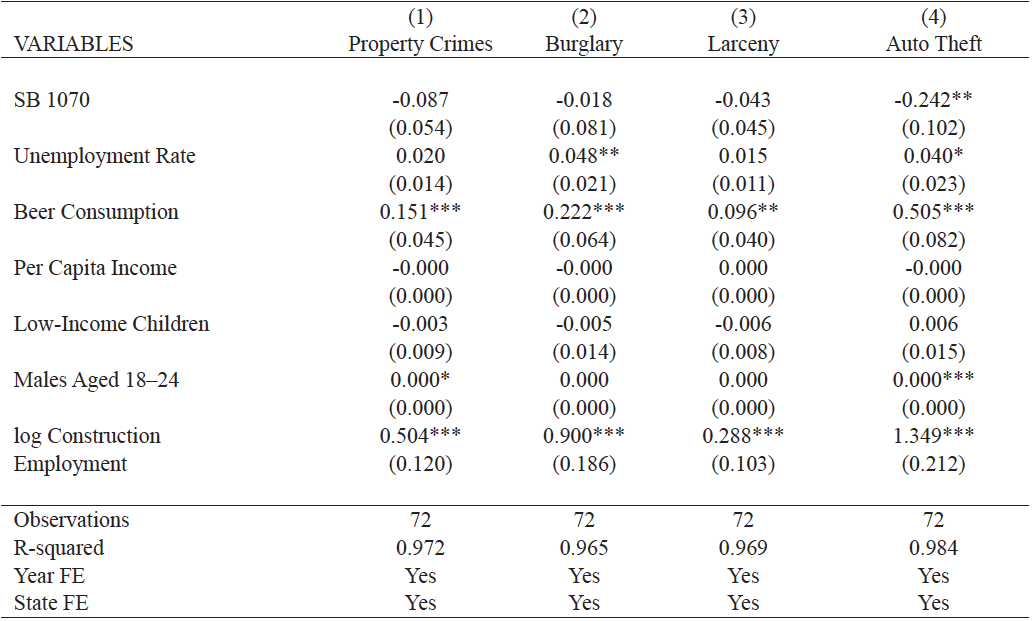
The results for violent crimes can be found in the appendix in table 3. The implementation of SB 1070 was associated with an increase in the violent crime rate, the rape rate, and the robbery rate, significant at the 1 percent level. SB 1070 was associated with a 29.9 percent increase in the violent crime rate in Arizona. SB 1070 was associated with a 39 percent increase in the rape rate and a 38 percent increase in the robbery rate. SB 1070 was also associated with a 27.6 percent increase in the assault rate, significant at the 10 percent level. For property crimes in table 4, I only find evidence of an effect on auto theft. SB 1070 was associated with a 24 percent decrease in the auto theft rate, statistically significant at the 5 percent level. The results suggest that SB 1070 was not associated with a change in property crimes, besides a decrease in auto theft.
I also developed a panel of data for estimations at the county level. I estimated the effects of Arizona SB 1070 on the natural log of the crime rate with the following equation:
(2)
where is a dummy variable representing the imposition of Arizona SB 1070.
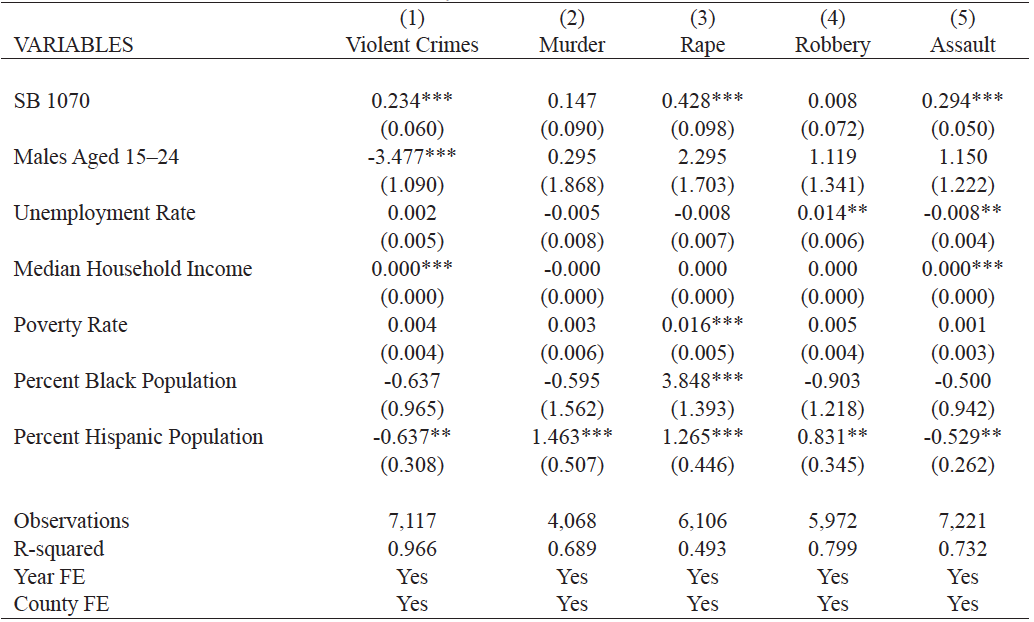
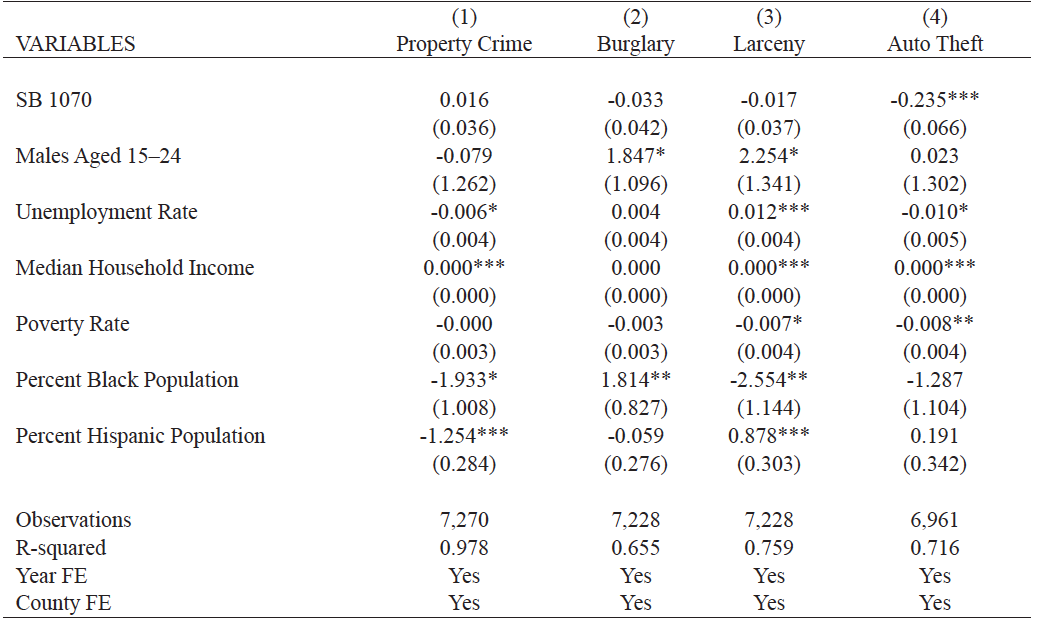
is a vector of county control variables. These include the county’s median income, the poverty rate, the percentage of males aged 18 to 24, the percentage of African Americans, and the percentage of people of Hispanic origin.
is a vector of county fixed effects, and
is a vector of time fixed effects. Including county and time fixed effects allows me to control for unobserved heterogeneity between counties or over time. ε represents the error.
Table 5 presents the estimates at the county level for violent crime. SB 1070 was associated with an increase in overall violent crime (23.6 percent), rape (42 percent), and assault (28.5 percent), significant at the 1 percent level. SB 1070 was also associated with an increase in murder and robbery, but this association was not statistically significant. Table 6 reports the results for property crimes. SB 1070 was associated with a decrease in auto theft (24.6 percent), significant at the 1 percent level.
4. Summary of Results
To summarize, SB 1070 was associated with a 20 percent increase in violent crime. This was statistically significant and robust to different matching variables and samples. Likewise, SB 1070 was associated with an increase in rape by 20 percent, which was robust to specification and statistically significant. SB 1070 also had an effect on assaults. The implementation of the law is associated with a 10 percent increase in assaults, which was statistically significant and robust to changes in the model. Findings for the state and county-level DID estimations were consistent with the SCM findings. Auto theft, which was statically significant and negatively associated with SB 1070 in the DID models, was not statistically significant using SCM.
Migration
While I found evidence that SB 1070 had an effect on crime, the effect on crime could have been caused by a change in the composition of the Arizona population. The law was designed for enforcement of federal immigration law through attrition. Not only would it likely reduce the non-citizen residents of Arizona, it would likely alter migration patterns. While the purpose is to reduce the number of unlawful residents, one would expect a decrease in lawful residents as well, as lawful residents do not want to experience the hassle associated with compliance to the law any more than illegal immigrants.
Chalfin and Deza (2020) find that Mexican immigrants are associated with an increase in property crime, particularly auto theft, in their study of the effects of LAWA in Arizona. They attribute this to the age profile of Mexican immigrants, who tend to be single males between 18 and 25, the demographic most associated with crime. In fact, the age and gender composition of the migrant population that left follow- ing its implementation can account for the entire decrease in crimes associated with LAWA for most of the crimes.
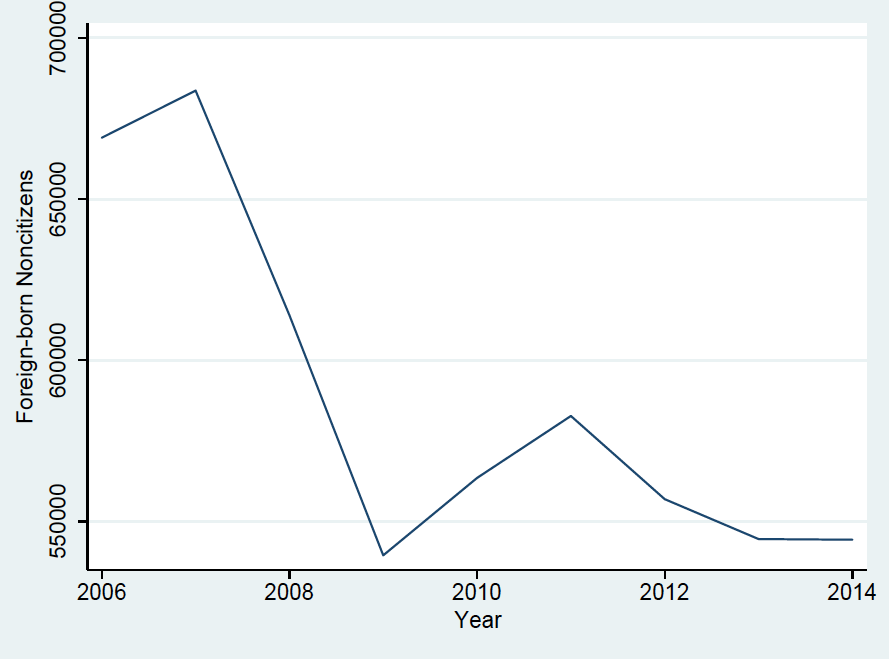
Like LAWA, SB 1070 makes employment more difficult for migrants and is associated with a general decline in the non-citizen resident population. Figure 5 shows that the number of foreign-born non-citizens remained low after the passage of SB 1070, but SB 1070 did not substantially decrease the number of foreign-born non-citizens like LAWA did. I did find evidence that SB 1070 was associated with fewer auto thefts, like Chalfin and Deza. However, because the number of foreign-born non-citizens did not decrease, I did not find similar decreases in other property crimes. This may be due to LAWA being effective in discouraging unlawful residents, giving SB 1070 little room to be effective in reducing crime further.
Because LAWA’s reduction in crime was caused by the change in demographics of the non-citizen foreign-born population, if SB 1070 was unable to change them further, then it would not be expected to reduce crime. Because LAWA caused a decline in the disproportionately young, single male migrant population of Arizona that tends to commit crimes, there was little room for SB 1070 to have a positive impact reducing crime. But still, it shifts law enforcement’s focus from other crimes to immigration-related offenses. Absent an increase in law enforcement resources, this is consistent with my findings.
Law Enforcement Resources
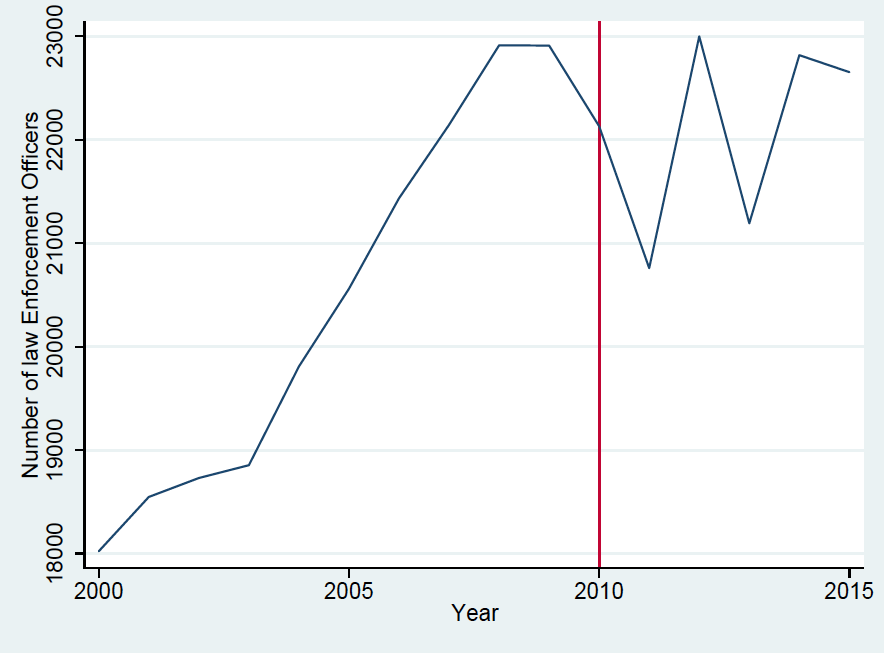
The implementation of SB 1070 has the potential to shift police resources and focus from violent crimes and property crimes to non-violent immigration-related offenses. Communicating with Immigration and Customs Enforcement, which is required when police believe they have evidence that the individual may be present illegally, adds considerable time to each stop. This time commitment reduces the amount of time that police are able to patrol and reduces the speed at which they can respond to other crimes in progress. Figure 6 shows the number of law enforcement officers in the state of Arizona from 2000 to 2015, gathered from the FBI UCR. While the number of officers increased during the 2000s decade, they did not increase after the implementation of SB 1070, which expanded law enforcement officers’ responsibilities. Without increasing the number of law enforcement officers, the additional focus of enforcing SB 1070 may have diverted police attention enough to reduce the effectiveness of SB 1070.
However, in response to the 2008 recession, the state of Arizona instituted a hiring freeze (Napolitano 2008). The hiring freeze left positions unfilled within the Gang and Immigration Intelligence Team Enforcement Mission (GIITEM) (Chung 2009). Because of the hiring freeze prompted by the recession, law enforcement was unable to substantially increase resources devoted to enforcing the new law. Without the hiring of new law enforcement personnel to help enforce the new law, they were forced to use the same amount of resources to enforce new and previously existing laws.
Because of the shift of police resources, natives face a lower opportunity cost of committing crimes after SB 1070. In the Becker model of crime, a smaller probability of apprehension decreases the expected sentence and increases the uncertainty of being apprehended. The results provide some evidence that this is occurring.
This focus on immigration-related offenses may lower the crime rate for illegal immigrants. However, because they are a much smaller group and immigrants tend to commit fewer crimes than natives, the increase in crimes by natives appears to offset or exceed this potential reduction. Expanding the responsibility of state and local enforcement to immigration law increases the cost and adds considerable training for law enforcement.
Conclusion
After passing LAWA in 2007, Arizona passed SB 1070 in 2010, giving local and state law enforcement more power to police immigration offenses. Between LAWA and SB 1070, the non-citizen, foreign-born population decreased from its high in the mid-2000s and remained lower. Research has shown that LAWA was also associated with a decrease in property crimes, but little research has examined SB 1070. This research explores the impact of SB 1070 on crime rates, using multiple estimation methods. Across estimates, SB 1070 is associated with an increase in violent crime by about 20 percent, specifically because of an increase in rape by about 40 percent and assault by about 30 percent. I also find a decrease in auto theft by 24 percent associated with SB 1070 in my DID estimations that was not present in my SCM estimations.
Without an appropriate control group to compare against Arizona, using a difference in differences approach for state-level data presented potential problems. Because of this, I used SCM. To further test the results, I also used state- and county-level data for DID estimations. SCM method allows for comparison against one unit matched to my treatment, which improves the accuracy of my model. Across models, I find consistent results and statistically significant results of an increase in violent crime, rape, and assault. I also consistently find a decrease in auto theft, although it loses significance in the SCM estimations.
My findings are consistent with past research showing a relationship between state and local enforcement of immigration offenses and increases in other crimes. Because Arizona instituted a hiring freeze for state employees in 2008 in response to the recession, law enforcement had to shift their focus without a corresponding increase in resources. With fewer resources available for deterring crimes relative to pre-SB 1070, potential criminals faced a lower likelihood of apprehension. Additionally, the unlawful residents remaining after LAWA would be less likely to report crimes to the police, which may increase their victimization and be another mechanism that increases violent crimes.
Because of other changes like LAWA and the recession, it is difficult to ascribe all of the post-2010 effects to SB 1070. Despite including several covariates related to both, I may have been unable to fully account for the other effects. While this may bias my results upward, overstating the effect, I find consistent, statistically significant results across models that suggest that SB 1070 is associated with an increase in violent crime, rape, and assault.
These and other similar findings are important because LAWA and SB 1070 have been used as models for other states. As politicians and the general public continue to debate the role of federal, state, and local enforcement of immigration law, finding evidence from early laws is important. Natural experiments of states adopting new laws provide researchers an opportunity to understand the mechanisms that effect crime and to estimate the effects of these laws.
Appendix
Table 1. Summary Statistics: Arizona
Table 2. Summary Statistics: Donor Pool
Table 3. DID Results: Violent Crime State Level
Robust standard errors in parentheses
*** p<0.01, ** p<0.05, * p<0.1
Table 4. DID Results: Property Crime State Level
Robust standard errors in parentheses
*** p<0.01, ** p<0.05, * p<0.1
Table 5. DID Results: Violent Crime County Level
Robust standard errors in parentheses
*** p<0.01, ** p<0.05, * p<0.1
Table 6. DID Results: Property Crime County Level
Robust standard errors in parentheses
*** p<0.01, ** p<0.05, * p<0.1
Table 7. Summary Statistics: Arizona vs. Control States
Table 8. State Weights in Synthetic Arizona
Note: Each row reports the percentage contribution of a given state to the synthetic control region for Arizona for a given crime type.
Figure 1. Violent Crime Rate: United States vs. Arizona
Figure 2. Property Crime Rate: United States vs. Arizona
Figure 3. Synthetic Control Method Estimates of the Effect of SB 1070 on Crime Measures Violent Crime
Murder
Rape
Robbery
Assault
Property Crime
Burglary
Larceny
Auto Theft
United States Department of Justice, Federal Bureau of Investigation. (2018). Crime in the United States, 2017.
Figure 4. Synthetic Control Method Estimates of the Effect of SB 1070 on Crime Measures, Robustness Test
Violent Crime
Murder
Rape
Robbery
Assault
Property Crime
Burglary
Larceny
Auto Theft
United States Department of Justice, Federal Bureau of Investigation. (2018). Crime in the United States, 2017.
Figure 5. The Number of Foreign-Born Non-citizens 2006–2014
U.S. Census Bureau. 2015. “Selected Characteristics of the Foreign-Born Population by Period of Entry into The United States.” 2015 American Community Survey 1-Year Estimates.
Figure 6. Number of Law Enforcement Officers in Arizona
United States Department of Justice, Federal Bureau of Investigation. (2018). Crime in the United States, 2017.
Synthetic Control Empirical Model
The observed outcomes for SCM can be written as the sum of the effect of the treatment, represented
by , and the potential outcome absent the treatment, represented by
. It can be expressed in the following form:
(3)
where is a dummy variable, which is coded as 1 for the treated units after time
and 0 otherwise. The time fixed effect is represented by
.
is a vector of time-invariant unobserved predictor variables with time-varying coefficients
.
is a vector of time-invariant measured predictors with a time-varying coefficient vector
. Finally,
captures the error.
Before the treatment in ,
represents the observed outcome for the treatment and control states. After
, it is impossible to observe the counterfactual of no treatment for the treated region. Therefore, the alternative is to estimate the treatment effect in the post-treatment period using the SCM-estimated values for the
by creating a synthetic control unit, the weighted linear combination of the donor states. The estimated effect for each treated unit at each period after
is
.
References
Abadie, Alberto, Alexis Diamond, and Jens Hainmueller. 2010. “Synthetic Control Methods for Comparative Case Studies: Estimating the Effect of California’s Tobacco Control Program.” Journal of the American Statistical Association 105, no. 490 ( June): 493–505.
Adelman, Robert, Lesley Williams Reid, Gail Markle, Saskia Weiss, and Charles Jaret. 2017. “Urban Crime Rates and the Changing Face of Immigration: Evidence across Four Decades.” Journal of Ethnicity in Criminal Justice 15 (1): 52–77.
Archibold, Randal. 2010. “Arizona Enacts Stringent Law on Immigration.” New York Times, April 24, 2010. https://www.nytimes.com/2010/04/24/us/politics/24immig.html.
Arizona Senate. 2010. Support Our Law Enforcement and Safe Neighborhoods Act. SB 1070, 49th Leg., 2d Reg. Sess.
Baker, Scott. 2015. “Effects of Immigrant Legalization on Crime.” American Economic Review: Papers & Proceedings 105 (5): 210–13.
Becker, Gary. 1968. “Crime and Punishment: An Economic Approach.” Journal of Political Economy 76 (2): 169–217.
Belczyk, Jaclyn. 2011. “Federal Appeals Court Blocks Alabama Immigration Law.” Jurist. https://www. jurist.org/news/2011/10/federal-appeals-court-blocks-alabama-immigration-law/.
Beer Institute. 2014. “Shipments of Malt Beverages and Per Capita Consumption by State.” http://www. beerinfo.com/index.php/pages/beerstateconsumption.html.
Bohn, Sarah, Magnus Lofstrom, and Steven Raphael. 2014. “Did the 2007 Legal Arizona Workers Act Reduce the State’s Unauthorized Immigrant Population?” Review of Economics and Statistics 96 (2): 258–69.
Bureau of Economic Analysis. 2017. “Regional Data GDP and Personal Income.” BEA Interactive Data Tables. https://apps.bea.gov/iTable/iTable.cfm?reqid=70&step=1&isuri=1&acrdn=6#reqid=70&- step=1&isuri=1.
Bureau of Labor Statistics. 2020. “Construction: NAICS 23.” Industries at a Glance. https://www.bls.gov/ iag/tgs/iag23.htm.
Chalfin, Aaron, and Monica Deza. 2020. “Immigration Enforcement, Crime and Demography: Evidence from the Legal Arizona Workers Act.” Criminology & Public Policy 19, no. 2 (May): 515–62.
Chung, Timothy. 2009. “DPS Leading the Charge Against Gang Violence.” East Valley Tribune. February 20, 2009. https://www.eastvalleytribune.com/opinion/dps-leading-the-charge-against-gang-violence/ article_f365fe0e-f27f-517d-9d78-01dbea6a261d.html.
Donohue, John J., III, and Steven D. Levitt. 2001. “The Impact of Legalized Abortion on Crime.” Quarterly Journal of Economics 116 (2): 379–420.
Evans, Tim. 2013. “Judge Permanently Blocks Parts of Ind. Immigration Law.” USA Today, March 29, 2013. https://www.usatoday.com/story/news/nation/2013/03/29/immigration-ruling-indi- ana/2036477/.
Fasani, Francesco, Giovanni Mastrobuoni, Emily Owens, and Paola Pinotti. 2019. “Immigration and Crime: Perceptions and Reality.” In Does Immigration Increase Crime? Migration Policy and the Creation of the Criminal Immigrant. Cambridge: Cambridge University Press.
Fiflis, Christina A. 2013. “Deferred Action for Childhood Arrivals.” GPSolo 30, no. 5: 28-32.
Freedman, Matthew, Emily Owens, and Sarah Bohn. 2018. “Immigration, Employment Opportunities, and Criminal Behavior.” American Economic Journal: Economic Policy, 10 (2): 117-51.
Fox13. 2014. “Federal Judge Blocks Portions of Utah Immigration Law.” June 18, 2014. https://fox13now. com/2014/06/18/federal-judge-blocks-portions-of-utah-immigration-law/.
Gomez, Alan. 2014. “South Carolina Puts Brakes on Immigration Law.” USA Today, March 3, 2013. https://www.usatoday.com/story/news/nation/2014/03/03/south-carolina-immigra- tion-law/5971023/.
Koper, Christopher, Thomas Guterbock, Daniel Woods, and Bruce Taylor. 2013. “The Effects of Local Immigration Enforcement on Crime and Disorder: A Case Study of Prince William County, Virgin- ia.” Criminology & Public Policy 12, no. 2 (May): 237–38.
Kowalski, Daniel. 2013. “Section 7 of Georgia’s HB 87 Permanently Enjoined.” LexisNexis. March 22, 2013. https://www.lexisnexis.com/legalnewsroom/immigration/b/ outsidenews/posts/section-7-of- georgia-s-hb-87-permanently-enjoined.
Lee, Matthew T., and Ramiro Martinez, Jr. 2002. “Social Disorganization Revisited: Mapping the Recent Immigration and Black Homicide Relationship in Northern Miami.” Sociological Focus 35:365–82.
Martinez, Ramiro, Jacob Stowell, and Matthew Lee. 2010. “Immigration and Crime in an Era of Transformation: A Longitudinal Analysis of Homicides in San Diego Neighborhoods, 1980–2000.” Criminology 48 (3): 797–829.
Massenkoff, Maxim, and Evan Rose. 2020. “Family Formation and Crime.” Working paper. February 5, 2020.
Miles, Thomas, and Adam Cox. 2014. “Does Immigration Enforcement Reduce Crime? Evidence from Secure Communities.” Journal of Law and Economics 57 (4): 937–73.
Napolitano, Janet. 2008. Letter from the governor. February 21, 2008. https://doa.az.gov/sites/default/files/gov-letter-022108.pdf.
Nowrasteh, Alex. 2015. “Immigration and Crime – What the Research Says.” Cato At Liberty. The Cato Institute, July 14, 2015. https://www.cato.org/blog/immigration-crime-what-research-says.
Nowrasteh, Alex, and Andrew Forrester. 2018. “Do Immigration Enforcement Programs Reduce Crime? Evidence from the 287(g) Program in North Carolina.” Cato Working Paper No. 52. The Cato Institute, Washington, DC.
Orrenius, Pia, and Madeline Zavodny. 2019. “Do Immigrants Threaten US Public Safety?” Journal on Migration and Human Security 7 (3): 52–61.
Pinotti, Paolo. 2015. “Immigration Enforcement and Crime.” American Economic Review, 105 (5): 205-
09.
Powell, Benjamin. 2015. Immigration: From Social Science to Public Policy. New York: Oxford University Press.
Sampson, Robert J. 2008. “Rethinking Crime and Immigration.” Contexts 7:28–33.
Shaw, Clifford, and Henry McKay. 1942. Juvenile Delinquency and Urban Areas: A Study of Rates of Delinquents in Relation to Differential Characteristics of Local Communities in American Cities. Chicago: University of Chicago Press.
Snyder, Howard. 2012. “Arrest in the United States, 1990–2010.” In Patterns and Trends. Washington, DC: Bureau of Justice Statistics.
Spenkuch, Jörg. 2014. “Understanding the Impact of Immigration on Crime.” American Law and Economics Review 16 (1): 177–219.
Treyger, Elina, Aaron Chalfin, and Charles Loeffler, 2014. “Immigration Enforcement, Policing, and Crime: Evidence from the Secure Communities Program.” Criminology & Public Policy 13 (2): 285–322.
U.S. Census Bureau. 2015. “Selected Characteristics of the Foreign-Born Population by Period of Entry into The United States.” 2015 American Community Survey 1-Year Estimates.
U.S. Census Bureau, Population Division. 2020. “State Population Estimates.” Population Estimates Pro- gram. https://www.census.gov/data/developers/data-sets/popest-popproj/popest.html.
United States Department of Justice, Federal Bureau of Investigation. (2001). Crime in the United States, 2000.
United States Department of Justice, Federal Bureau of Investigation. (2002). Crime in the United States, 2001.
United States Department of Justice, Federal Bureau of Investigation. (2003). Crime in the United States, 2002.
United States Department of Justice, Federal Bureau of Investigation. (2004). Crime in the United States, 2003.
United States Department of Justice, Federal Bureau of Investigation. (2005). Crime in the United States, 2004.
United States Department of Justice, Federal Bureau of Investigation. (2006). Crime in the United States, 2005.
United States Department of Justice, Federal Bureau of Investigation. (2007). Crime in the United States, 2006.
United States Department of Justice, Federal Bureau of Investigation. (2008). Crime in the United States, 2007.
United States Department of Justice, Federal Bureau of Investigation. (2009). Crime in the United States, 2008.
United States Department of Justice, Federal Bureau of Investigation. (2010). Crime in the United States, 2009.
United States Department of Justice, Federal Bureau of Investigation. (2011). Crime in the United States, 2010.
United States Department of Justice, Federal Bureau of Investigation. (2012). Crime in the United States, 2011.
United States Department of Justice, Federal Bureau of Investigation. (2013). Crime in the United States, 2012.
United States Department of Justice, Federal Bureau of Investigation. (2014). Crime in the United States, 2013.
United States Department of Justice, Federal Bureau of Investigation. (2015). Crime in the United States, 2014.
United States Department of Justice, Federal Bureau of Investigation. (2016). Crime in the United States, 2015.
United States Department of Justice, Federal Bureau of Investigation. (2017). Crime in the United States, 2016.
United States Department of Justice, Federal Bureau of Investigation. (2018). Crime in the United States, 2017.
University of Kentucky Center for Poverty Research. 2019. “UKCPR National Welfare Data, 1980-2018.” http://ukcpr.org/resources/national-welfare-data.


 Cato Institute
 Arizona Daily Star
 This Is Tucson
 America’s Voice