


1 Introduction
While US immigration reform has largely been stalled since 1996, attempts to address the inflow of crossings at the US–Mexico border have occurred over the past three decades. As part of the war on terror, which began after the terrorist attacks in New York City and Washington, DC in September 2001, Congress passed, and President Bush signed, the Secure Fence Act of 2006 (hereafter SFA). The SFA authorized the construction of hundreds of miles of additional fencing, more vehicle barriers, checkpoints, and other technologies like cameras, satellites, and unmanned aerial vehicles (UAVs, or “drones”) to stop illegal crossings and prevent possible acts of terrorism.
By April 2009, the Department of Homeland Security (DHS) had erected about 613 miles of new pedestrian fencing and vehicle barriers along the Southwest border from California to Texas. Given that the impact of such barriers on migrant crossings continues to be the subject of debate today (see Sherwood, 2008; Getmansky, Grossman, and Wright, 2019; Kim, Kim, and McNeely, 2020; Klopstock, 2022), and as US states elect to erect additional border barriers using their own funding (Beeferman, 2022; Garcia, 2022), understanding the overall effect (both intended and unintended) of past efforts is of utmost importance to inform immigration policy.
In this spatial analysis, we examine several consequences of the border walls constructed under the SFA. Specifically, we analyze the likelihood that attempted crossers changed routes, faced increased danger, and possibly lost their lives doing so after the SFA was introduced. To do so, we evaluate the locations of migrant deaths in southern Arizona along the US–Mexico border before and after the SFA’s passage, using hot-spot analysis to reveal a substantial increase in deaths post-SFA. Statistical analysis of migrant deaths and Geographic Information Systems (GIS) data and analysis identifies nonrandom clusters or “hot-spot” locations where migrant deaths are occurring. Further, we create a danger index along the Arizona–Mexico border, which we use to compare hot-spot locations with nearby gaps in the border fencing to ascertain if migrants are being forced to cross in more dangerous locations.
We contribute to three strands of the literature. First, we contribute to the literature on immigration enforcement in the United States and how migration policy influences migrant behavior. We do this by by using a data set that combines three unique sources and introducing a statistical approach that combines hot-spot analysis with a novel danger index to understand changes in migrant movements across the US–Mexico border.
Second, we add to the literature on the effects of border barriers—namely border walls. We contribute by examining the effects of the SFA. Additionally, we further the discussion on the effects of border walls and their ability to divert and detour potential migrants. Third and finally, we provide more insights into the costs and consequences of the war on terror. While much of the literature focuses on the monetary costs of counterterrorism policies, we contribute to the small but growing literature on the nonpecuniary costs of these policies. Our work extends this literature by highlighting one of the human costs of these policies—losing one’s life attempting to migrate to the United States.
The rest of the paper proceeds as follows. Section 2 discusses the background and recent history of enforcement along the southern US border. Section 3 presents our data and methodology, including a detailed explanation of hot-spot analysis and creation of the danger index. In Section 4, we discuss our results, highlighting the empirical findings and discussing the relevant institutional factors we believe influence these results. Section 5 concludes.
2 Background on Border Policies: 1986 to 2020
The 1986 Immigration Reform and Control Act (IRCA) was designed to reduce both the level and flow of undocumented immigration and had a three-pronged approach. The first part granted legal status to approximately 2.5 million undocumented immigrants in the United States through two different amnesty programs (US Census Bureau, 1994). In the second part, the IRCA imposed criminal penalties (employer sanctions) on domestic firms that knowingly employed undocumented immigrants. Last, IRCA increased the amount of resources directed at border security (Watson and Thompson, 2021, p. 76–77). As a result, between 1990 and 2000, the budget of the US Border Patrol quadrupled from $263 million to $1.055 billion (American Immigration Council, 2021).
In addition to providing for more Border Patrol agents, the increased funding also allowed for the deployment of new technologies and improved infrastructure along the US southern border. These technologies included high-intensity lighting, thermal imaging scopes, motion-detecting sensors, and remote video surveillance. Infrastructure enhancements included the construction of 76 miles of 10-foot-high steel fencing and the construction of new roads along the border (Cornelius, 2001).
Throughout the 1990s, the Clinton administration used these additional resources to employ a strategy of “prevention through deterrence” by fortifying the busiest crossing area of the border by irregular immigrants or those entering without inspection (EWI). Three major enforcement programs were introduced in 1993 and 1994. Beginning in 1993, Operation Hold the Line channeled resources along the border around El Paso, Texas. Citing a dramatic reduction in apprehensions in areas where agents and technology were deployed, the Border Patrol hailed Operation Hold the Line as a success and sought to expand to other areas. In 1994, the Border Patrol launched Operation Gatekeeper in San Diego, California, reporting that San Diego saw a 75 percent reduction in illegal crossings in the following few years (US Customs and Border Protection, 2020).
In the third program, the Border Patrol launched Operation Safeguard in 1994 in the Tucson Sector. However, the resources dedicated to Operation Safeguard were insufficient to match the initial successes of the Hold the Line and Gatekeeper operations. This was primarily because the measured success of operations in San Diego and El Paso was a result of diversion rather than deterrence. That is, the reduced number of apprehensions experienced in those areas was due to migrants choosing to cross elsewhere, primarily in Arizona, thus overwhelming the Border Patrol in that sector. In response, the Border Patrol later allocated more resources to the Tucson Sector in Operation Safeguard 99 (US Department of Justice, 2002).
The initial results in the Tucson Sector were not necessarily a failure in the eyes of policymakers. Indeed, these results were, somewhat, the point of the “prevention through deterrence” strategy. By cutting off access to border crossings that were relatively easy, would-be migrants would have to travel farther and in less hospitable environments to evade Border Patrol. This would also increase the need for migrants to rely on human smugglers—coyotes—to help them navigate through the desert and mountains. The hope among policymakers was that making crossing the border more arduous and expensive would reduce the number of people wanting to make the trip. Additionally, making migrants travel farther in more remote areas would give Border Patrol agents more time to find and apprehend them during their journey (Eschbach, Hagan, and Rodriguez, 2003).
Following the terror attacks on September 11, 2001, the Homeland Security Act of 2002 created the DHS, under which immigration enforcement duties previously performed by the Immigration and Naturalization Service (INS) were transferred to two newly formed agencies: Customs and Border Protection (CBP) and Immigration and Customs Enforcement. The INS, which had previously been housed under the Department of Labor and, later, under the Department of Justice, was subsequently dissolved. This changed the public perception of the need to prevent illegal immigration from protecting American workers from competition, or the sanctity of the rule of law, into a matter of national security.
The language of the subsequent SFA reinforces this new view of illegal immigration as a national security threat. It states that it is intended to achieve “operational control” of the border, meaning “the prevention of all unlawful entries into the United States, including entries by terrorists, other unlawful aliens, instruments of terrorism, narcotics, and other contraband” (Secure Fence Act, 2006, p. 2638).
Designating the southern US border as one of the fronts in the Global War on Terror opened the door for vast amounts of resources to be directed toward efforts to prevent illegal border crossings. In addition to the billions of dollars spent constructing fencing along the border, between 2003 and 2021, the CBP’s annual budget grew from $1.5 billion to $4.9 billion (US Government Accountability Office, 2018). The annual budget of Immigration and Customs Enforcement, which is tasked with immigration enforcement in the interior of the United States, grew from $3.3 billion to $8.3 billion in that same period (American Immigration Council, 2021).
3 Literature Review
While multiple studies have cast doubt on whether these enforcement operations had a deterring effect on migrants’ decisions to cross the border (Hanson and Spilimbergo, 1999; US Government Accountability Office, 2001; Bansak, Blanco, and Coon, 2022), there were several other consequences that are made clear in the data. First, given the increased difficulty in crossing, migrants were now much more likely to hire a smuggler to assist them, increasing the prices that smugglers charged (Massey 2017). Second, upon successfully entering the United States, migrants were much less likely to return to Mexico due to the difficulty of reentry (Massey, Durand, and Pren, 2016). Finally, there was a dramatic increase in the number of migrants who died attempting to cross the border (Cornelius, 2001; Bansak, Blanco, and Coon, 2022).
3.1 Deaths at the Border
Although the Border Patrol did not begin systematically recording border-crossing deaths until 1998, several studies compiled estimates of the number of deaths in the preceding period. Cornelius (2001) examines the number of deaths crossing the Mexico–California border reported to Mexican consulates between 1994 and 2000. In 1994, before the beginning of increased enforcement operations, 23 migrant deaths were reported, the majority of which were due to traffic accidents as migrants attempted to cross busy highways in urban areas. Between 1995 and 2000, an average of 81 deaths occurred per year. This growth rate was much larger than that of apprehensions, a proxy for the number of attempted crossings, suggesting that the increase in deaths was not merely due to more attempts to cross. Rather, the increase was mostly attributable to causes other than traffic accidents, such as hypothermia, dehydration, sunstroke, and drowning. This pattern suggests that the rise in deaths was primarily due to a change in crossing locations, driven by the Border Patrol’s increased enforcement operations.
In another set of studies, Eschbach et al. (1999) and Eschbach, Hagan, and Rodriguez (2003) compile data from medical examiners and other vital statistics records to examine the number of deaths between 1995 and 2002. They find a similar number of deaths per year for the periods before and after increased enforcement operations. However, the data follow a u-shaped pattern; that is, deaths were declining before 1994 and rising after 1994. They also find that extreme hot and cold temperatures were significant factors in the post-1994 period, stating that “it is now unambiguous that redirection of migrant flows . . . takes the lives of perhaps 100 persons per year.” Given that these findings only represent cases that can be documented through vital records, this is certainly an undercount of the true number (Eschbach, Hagan, and Rodriguez 2003, p. 47).
Using data from the Pima County Medical Examiner’s Office (PCMOE), Rubio-Goldsmith et al. (2006) examine changes in migrant deaths between the periods of 1990–1999 and 2000–2005. They refer to these periods as “pre-funnel effect” and “post-funnel effect” periods, since after 1999, all the major Border Patrol increased enforcement operations (Hold the Line, Gatekeeper, and Safeguard 99) were in full effect. They find that in the pre-funnel effect period, PCMOE handled an average of 14 migrant deaths per year, whereas in the funnel effect period, that number increased to a staggering 160 migrant deaths per year.
A later report by the Binational Migration Institute (Martinez et al., 2013) analyzes PCMOE data to examine changes in migrant deaths in what it calls the “late funnel effect period” (2006–2012). While the average number of deaths in this period are similar to those in the funnel effect period, they find the death rate, measured as deaths per 100,000 apprehensions, grew exponentially, from 45.5 per 100,000 in 2005 to 142.5 per 100,000 in 2012. They also find a significant decline in the share of deaths from vehicle accidents, suggesting that a larger share of migrants was crossing by foot after 2005. While the authors note that the increase in the death rate is likely due to migrants “crossing for longer periods of time through more remote areas to avoid detection by US authorities” (Martinez et al., 2013, p. 27), they do not identify a policy change that would lead to such a dramatic change in the death rate in this portion of the US–Mexico border.
Chambers et al. (2021) use geospatial data on terrain, along with locations of border surveillance towers, to estimate the rate of bodily energy expenditure required along different routes taken to avoid detection from the towers. They compare this with location data on recovered migrant remains to identify what they call a “third funnel effect” period. Martinez et al. (2021) examine the locations of recovered migrant remains across what they refer to as the “four funnel effect periods.” The four funnel effect periods include the three mentioned above as well as what the authors refer to as the “localized funnel effect” (Martinez et al., 2021, p. 20).
Other studies examine the effects of border walls on migrant behavior, particularly deterrence (see Haddal, Kim, and Garcia, 2009; Gambler, 2017). There is clear empirical evidence that instead of deterring migrant crossings, border fencing induces migrants to divert or detour (Feigenberg, 2020; Allen, Dobbin, and Morten, 2019). Feigenberg (2020), for example, finds a deterrent effect for low-skilled migrants. The construction of pedestrian fencing resulted in a 27 percent decrease in crossings in the area in which the new fencing was built. Allen, Dobbin, and Morten (2019) find that border wall construction had minimal to no effect on the overall number of crossings but did alter migrants’ choices related to destination and route.
3.2 Deaths at the Border and Counterterrorism Policy
While many analyses focus on the monetary cost of the ongoing “war” on terror, others have highlighted how counterterrorism policies in the post-9/11 era have led to various nonpecuniary costs both at home and abroad (see Goodman and Coyne, 2022; Coyne and Hall, 2014, 2016, 2018a,b; Coyne et al., 2014; Hall, Hassell, and Fitch, 2021). For example, Goodman and Coyne (2002) highlight how counterterrorism policies have effectively “militarized” the border. Coyne and Hall (2018) note the expanded use of military technologies along the US southern border as part of counterterrorism operations. Thus, the war on terror and immigration policy are intimately interconnected.
We contribute to these literatures by highlighting yet another nonpecuniary cost of the war on terror—human lives along the US–Mexico border. We build on the existing literature by incorporating data related to the construction of border fencing following the SFA with data on recovered migrant remains, illustrating how the new fencing altered migrant crossing routes and consequently increased migrant deaths. Additionally, we extend the work of Martinez et al. (2021) by constructing a geographic danger index for different potential crossing routes along the Arizona–Mexico border, showing how, following the SFA, migrants’ route options became more dangerous, leading to an increase in deaths and altering the location of these fatalities. We not only observe the changes in migration patterns due to the SFA but also highlight how these changes impact the health and well-being of migrants.
4 Data and Methodology
4.1 Methodology
Our work applies GIS analysis to a combination of three data sets to observe the effects of the SFA on migration patterns. GIS is a software designed to analyze spatial patterns, including migration. Chambers et al. (2021), for example, use GIS to study potential migrant routes for avoiding encounters with border patrol, and Giordano and Spradley (2017) use it to find a relationship between border patrol arrests and migrant deaths. In this paper, we use hot-spot analysis to analyze the effects of the SFA on both migrant route and migrant deaths.
To analyze these effects, we use GIS and a four-step process. We first calculate a danger index along the Arizona border to determine the level of difficulty crossing the border. Next, we review the locations of barrier fencing pre- and post-SFA, and conduct a hot-spot analysis to determine the difference, if any, in death locations in those two periods. Finally, we compare any new death locations with gaps in the border fencing and the danger index to see if migrants are being forced to cross through more dangerous areas, thus contributing to the increase in deaths.
To create the danger index, we use six different factors, grouped into categories and scored. Higher scores indicate greater danger or difficulty crossing the border. The first three factors are 1) distance to a major road, 2) distance to a major city, and 3) distance to tribal lands. The further the distance, the more dangerous it becomes since there is a lower likelihood of finding help if in distress. Table 1 shows the categories and scores for these three factors.
The next two factors are 1) distance to a major river and 2) distance to a desert. The shorter the distance to these natural hazards, the more dangerous it becomes as it is more likely that a direct path would have to traverse these areas. Table 2 shows the categories and scores for these two factors. The final, sixth factor is the terrain’s slope. The greater the slope, the steeper the climb, and thus the more difficult and dangerous to traverse. Table 3 shows the categories and scores for this factor.
To create the danger index, we sum the scores of all six factors, equally weighing each factor. The higher the total score, the more difficult or dangerous the area is to cross. We then add the locations of border fencing to our analysis, including both pedestrian and vehicle borders . Border fencing is separated into two time periods, 2000–2007 and 2008–2019, to bracket the passage of the SFA.
Next, we use a hot-spot analysis to evaluate locations of deaths before and after the SFA. Hot-spot analysis is a statistical technique to evaluate the grouping of locations of a particular outcome relative to themselves, determining if the patterns of these occurrences are random. It is often used in crime and traffic analysis to analyze prior patterns and predict future events (Hajela, Chawla, and Rasool, 2020; Ratcliffe, 2010; Bíl, Andrášik, and Sedoník, 2019; Lee and Khattak, 2019), and has been used to evaluate refugee movements (Petutschnig et al., 2020), the clustering of migrant mortalities over time (Boyce, Chambers, and Launius, 2019), and migration patterns (Chambers, 2020; Giordano and Spradley, 2017).
Our null hypothesis is that there is complete spatial randomness of the death locations, and we use GIS software to calculate the  statistic, which “detect(s) local pockets of dependence” (Getis and Ord, 1992). The statistic
  calculates the location of each death relative to locations of neighboring deaths and is a spatially weighted Z-score, where
  is the number of observations,
  s are the weights, and
  is our variable of interest.
A higher positive Z-score and a lower p value represent statistically significant hot spots (above the mean), while a higher negative Z-score and a lower p value represent statistically significant cold spots (below the mean). Thus, a hot spot is determined to occur if there is a very low chance that such a clustering is random. (For example, a hot spot is determined where the critical value, Z-score, is 4.996 and the probability, p value, is 0.000001, indicating a less than 1 percent chance the hot spot is random.) In our analysis a hot-spot analysis represents a high probability that a cluster of deaths occurred for some reason, that is, not random, within the study’s two time periods, before (2000–2007) and after (2008–2020) the SFA.
Last, we analyze the hot-spot locations before and after the SFA with border fencing erected both before and after the SFA. Some gaps in border fencing were closed after the SFA, while others remained open.
4.2 Data Sources
Our data come from multiple sources. The data on migrant deaths for the Mexico–Arizona border come from the Arizona OpenGIS Initiative for Deceased Migrants, which is a collaboration between PCMOE and Humane Borders, Inc. (Humane Borders n.d.). The data set contains information about human deaths presumed to be due to unauthorized border crossings between 2000 and 2019. It is comprised of 3,041 records, with data on gender, age, reporting date, location, cause of death, latitude, longitude, and county of death.
We split our analysis into two, equal time periods surrounding the SFA, that is, pre-SFA (2000–2007) with 1,215 recorded deaths and post-SFA (2008–2019) with 1,826 recorded deaths. Deaths that occurred in 2008 but whose postmortem revealed the death happened more than six to eight months prior were moved from the pre-SFA data set and to the post-SFA data set. Several observations contained a blank postmortem field.
Although we have data on when the human remains were discovered, we cannot identify when the death occurred. Therefore, we remove deaths found after 2007 from the pre-SFA data set. Table 4 presents summary statistics for the pre-SFA data set, the post-SFA data set, and combined total deaths. Descriptive analysis on the death data indicates that of those with age identifiers, two-thirds were young—aged 30 or less—and most either died of exposure (38 percent) or were undetermined (49 percent). There is very little evidence of violence or conflict.
The Arizona OpenGIS Initiative for Deceased Migrants data set includes location information for each observation, which was converted into a point shapefile. To create a spatial layer, we use ArcGIS 10.8 and the latitude and longitude fields. For visual reference, we select a second spatial layer of Arizona counties from the US Census Bureau’s TIGER/Line Geodatabase for Arizona, 2021. As the spatial location also identifies the county, we can review the county information in the data for accuracy. Specifically, we can update 60 records listed as an unknown county and one incorrectly identified county.
To test further hypotheses regarding the dangers of crossing, diversion tactics, and land characteristics of crossing, we add several other spatial layers. These include US border fencing by year extracted from Castañeda and Guerrero (2017); tribal lands obtained from the Census Bureau’s TIGER/Line Geodatabase for American Indian Areas; and desert locations obtained from the US Geological Survey’s 2006 survey (Deserts of the Southwestern United States). Last, we add basemap layers for reference (country boundaries, water bodies, and state boundaries).
4 Results
4.1 Visual Data Analysis
Figure 1 displays the geographic area of our study. Along the border, blue lines represent areas where fencing existed in 2007 or before, and yellow lines represent fencing in 2008 or later. The brown dashed line represents the boundary of the Sonoran Desert, and the purple dashed line represents the border of the Tohono O’odham Nation Reservation. Solid gray lines represent major roads and highways. Major Arizona cities and select Mexican cities are shown for reference.
Two cities are the most likely initial destinations for migrants—Tucson and Phoenix, AZ. There are three relevant ports of entry: Nogales, Sasabe, and Sonoyta. The Nogales Port of Entry lies at the southern end of Interstate Highway 19 (I-19). If one were taking the most direct route to the nearest major city—Tucson, AZ—they would simply head north on I-19 for 70 miles. However, that route lies entirely within the CBP’s 100-mile jurisdictional range. Thus, undocumented migrants attempting to travel along I-19 are susceptible to being apprehended at checkpoints along the route.
Alternatively, migrants may wish to reach the alternate destination of Phoenix, AZ. Phoenix, more than 100 miles inland of the border, falls outside of the CBP’s jurisdiction. Considering the “best” or “easiest” route is not as straightforward. In this case, there are multiple possible routes, if crossers need not be concerned with detection and apprehension. By car, Phoenix is roughly equidistant from the Nogales, Sasabe, and Sonoyta ports of entry, with distances ranging from 150 to 180 miles. However, the data suggest that migrants traveling to Phoenix are similarly attempting to avoid CBP checkpoints by traveling through the desert, as can be seen by the deaths south of Phoenix and to the west of the I-85 and AZ state highways (see Figure 4).
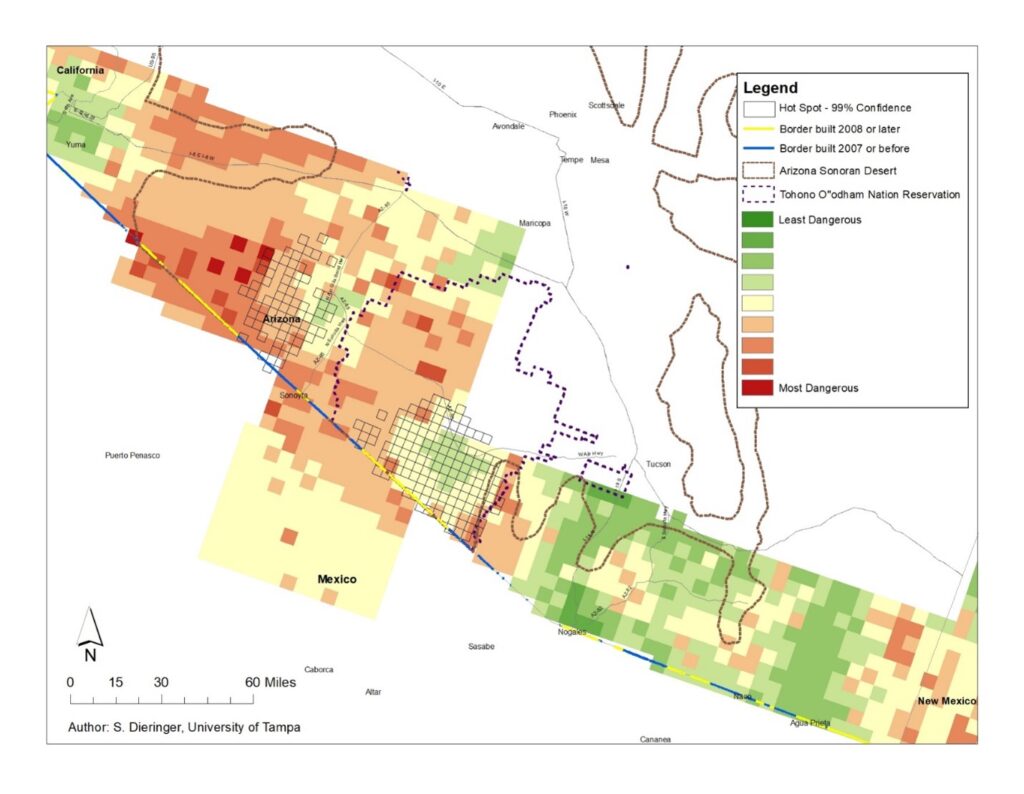
Figure 2 presents the results of our constructed danger index. Areas in dark green are the least dangerous, while those in red are most dangerous. As shown in Figure 2, the most dangerous areas are in the western region in the Sonoran Desert, while the least dangerous region is to the east of the Tohono O’odham Nation Reservation. Based on this, we would expect there to be a larger number of deaths in the western region of our study area than in the eastern region.
The complete data set is visualized in Figure 3, with each green dot representing a location where migrant remains were recovered between 2000 and 2019. As expected from our danger index, the number of deaths occurring in the western region of our study area is indeed higher than in the eastern region. However, the distribution of deaths varies distinctly between the two periods before and after the SFA.
Figures 4 and 5 display the locations of migrant remains discovered before and after 2007, respectively. Before 2007, there was very little fencing along the US–Mexico border, denoted in blue, and it was primarily located around the major ports of entry. After 2007, fencing was added, denoted in yellow, to cover almost the entire border. In Figure 4 it is clear that the majority of remains were discovered in the area of the Sonoran Desert that lies to the east of the Lukeville Port of Entry at Sonoyta and to the west of the Nogales Port of Entry. In reviewing the data, it is worth noting the difference between the route migrants appear to be taking compared to more direct routes—paths that they would likely take if they had no concern regarding capture.
Before 2008, there was very little existing fence along the border, located near the three ports of entry mentioned above, as indicated by the blue lines along the border. After 2008, most of the southern border had barrier fence installed. The new sections of fencing are indicated by the yellow lines in Figures 4 and 5. Visual inspection of the figures would suggest that deaths before 2008 were more geographically dispersed than after 2008. Additionally, after 2008, there was a 50 percent increase in remains recovered (see Table 4), and deaths appear to be more heavily concentrated between the Sonoyta and Sasabe ports of entry.
4.2 Hot-Spot Analysis
Figure 6 shows the results of the hot-spot analysis in the pre-SFA time period (2000–2007). The dark red squares represent locations with G*-statistics at the 99 percent confidence level (p value < 0.01), indicating that deaths at these locations are highly unlikely to be random. These few areas are located within the Sonoran Desert but outside the Tohono O’odham Nation Reservation boundary. Medium-colored red squares represent locations with 95 percent confidence, indicating clustering near the eastern edge of the reservation and within the desert. Light-colored beige squares denote less significant hot spots, with confidence levels below 95 percent. These locations are dispersed throughout the reservation and within other sections of the Sonoran Desert.
Figure 7 shows the results of the hot-spot analysis post-SFA (2008–2019). These are our main findings, and the comparison between Figures 6 and 7 show the disparate dispersion and number of hot spots. Specifically, in the post-SFA period, shown in Figure 7, there is a much larger number of highly significant areas (99 percent confidence). The largest group of hot spots or cluster is almost entirely within the Tohono O’odham Nation Reservation and closer to the US–Mexico border. While this region contained a hot-spot cluster before 2008, the cluster has shifted westward and is much more concentrated. The second large cluster of highly significant hot spots lies to the west of the Sonoyta Port of Entry.
To examine the role that the SFA played in this change, we combine our data sets to superimpose our significant hotspots over our danger index and include the border fence location in Figure 8. Interestingly, the eastern hot-spot cluster is primarily located in a relatively safe region. However, the region contains a significant amount of new fencing. As such, migrants passing through after 2008 would have had to travel a much larger distance compared to those passing through before 2008. This is consistent with Chambers et al. (2021)’s model of bodily energy expenditure. To reach this relatively safer area, migrants would first have had to travel through the more dangerous area first; the same applies to the western hot-spot cluster. Although this cluster is largely contained in a relatively more dangerous region, the area west of the cluster is even more dangerous.
Furthermore, the new border fence erected after 2008 has extended the distance migrants must travel to reach the area where remains were discovered. This suggests that the construction of the border wall, as part of the SFA, altered the paths of migrants attempting to cross the border. As a result, migrants started to move further west and deeper into the Tohono O’odham Nation Reservation, both routes leading to increased nonrandom clusters of deaths.
5 Conclusion
Our work suggests that fencing policy along the US–Mexico border increased the likelihood of death for migrants and directly affected the path(s) migrants elect—as illustrated by the number of deaths and the significant westward shift of where remains were recovered in the post-SFA period. We propose that the fence’s construction led to this result in two ways. First, much of the fence built in this region consisted of vehicle barriers, which prevented vehicles from crossing but generally allowed pedestrians to cross by foot. To the extent that migrants chose to cross in the same location, crossing the desert on foot is much more dangerous than by vehicle, thus increasing the chance of death. Second, the construction of the border fence also changed where migrants chose to cross, increasing the total distance they must travel to reach their destinations and thereby raising the risk of death.
Our results provide evidence for both cases. The larger cluster of highly significant hot spots within the Tohono O’odham Nation Reservation is likely due to the construction of vehicle barriers along the border within the reservation. However, more research is needed to determine how the reservation’s presence impacts migrant flows. While some on the reservation work to actively help migrants cross, others work to actively deter them (see Filzen 2013). The interaction between these dynamics and the fencing is currently unclear. The large cluster of highly significant hot spots to the west of Sonoyta is likely due to changes in where migrants cross, forcing them to cross further west and therefore travel much further through the desert. As part of the United States’s strategy of “prevention through deterrence,” one of the SFA’s goals was to make crossing the border without inspection so risky that migrants would no longer attempt to enter the country. However, our analysis indicates that despite the added danger, migrants were simply diverted to take alternate routes. In turn, this led to more migrants dying during their journey across the border. As such, if the United States truly wishes to reduce undocumented immigrant flows, polices other than “more enforcement” will likely be necessary.
Tables and Figures
Figure 1. Geographic Features of Arizona–Mexico Border
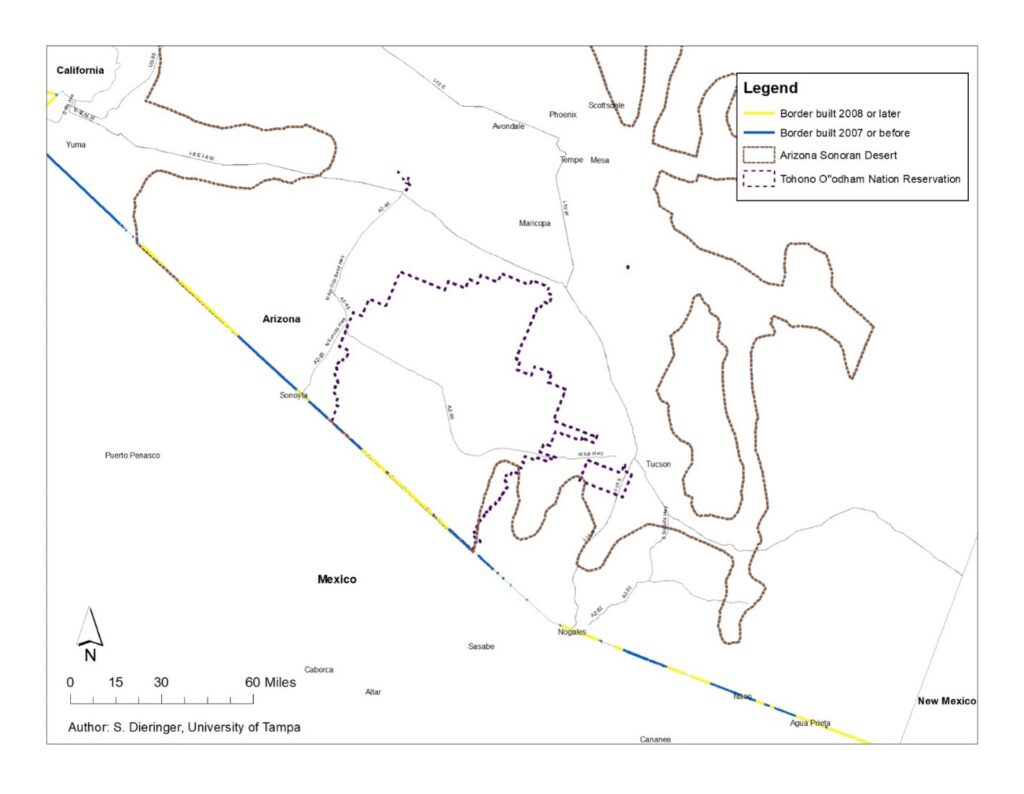
Figure 2. Danger Index
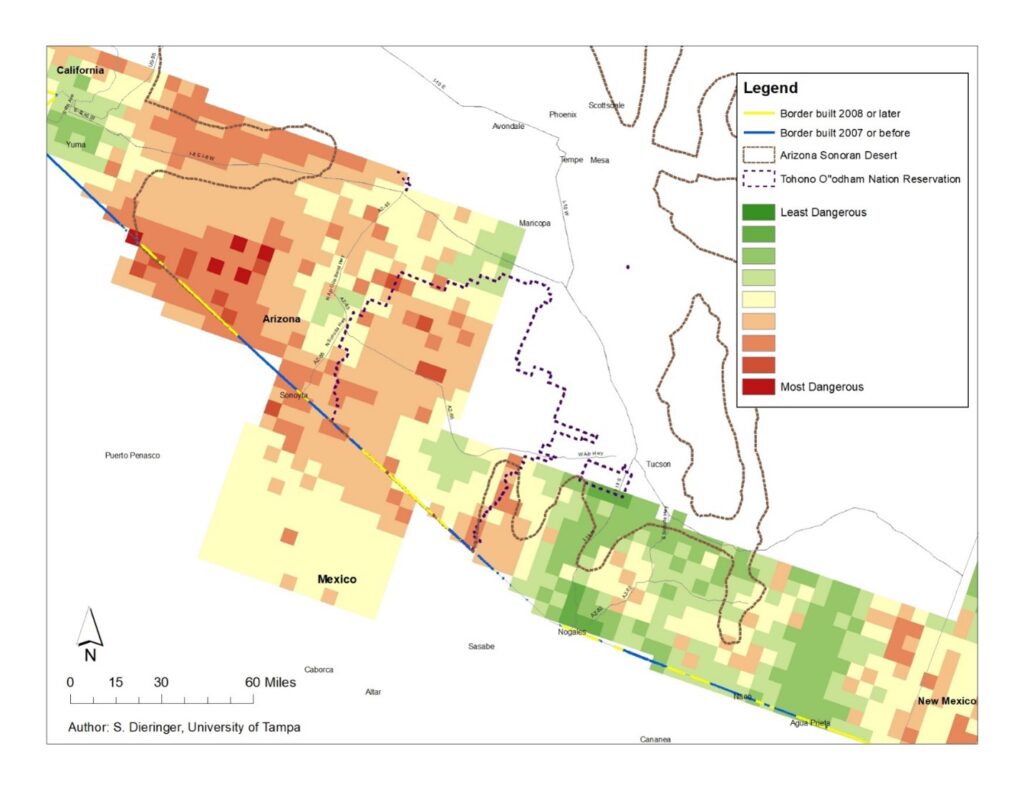
Figure 3. Migrant Deaths, 2000–2019
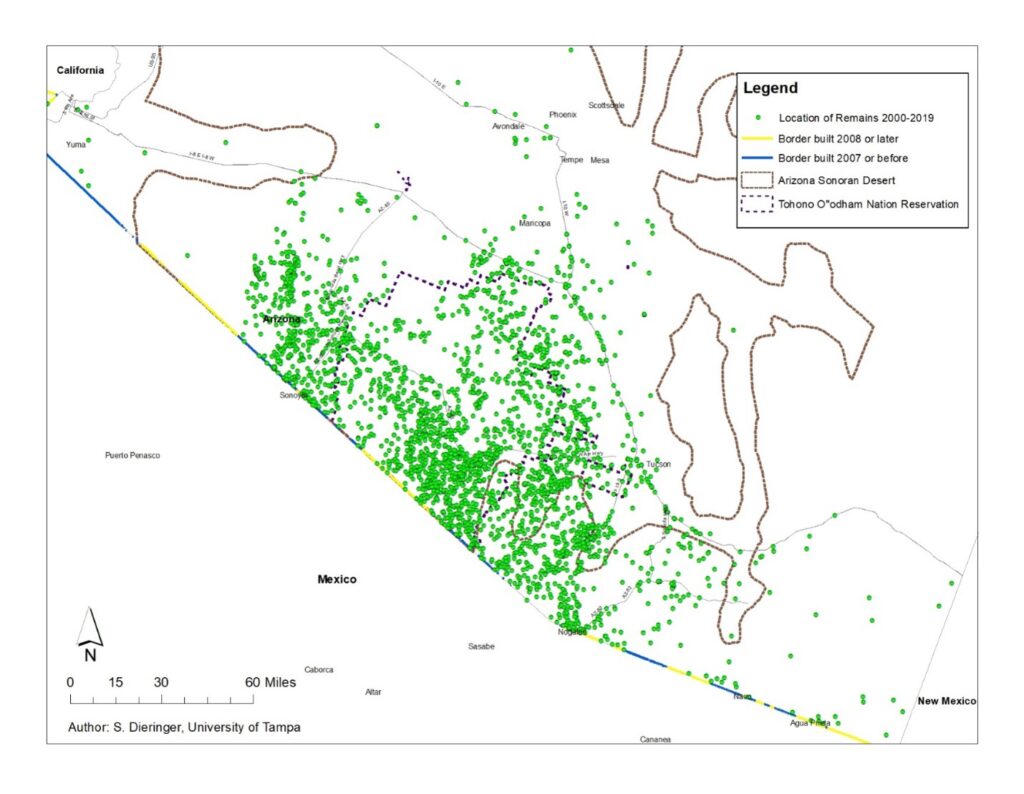
Figure 4. Migrant Deaths, 2000–2007
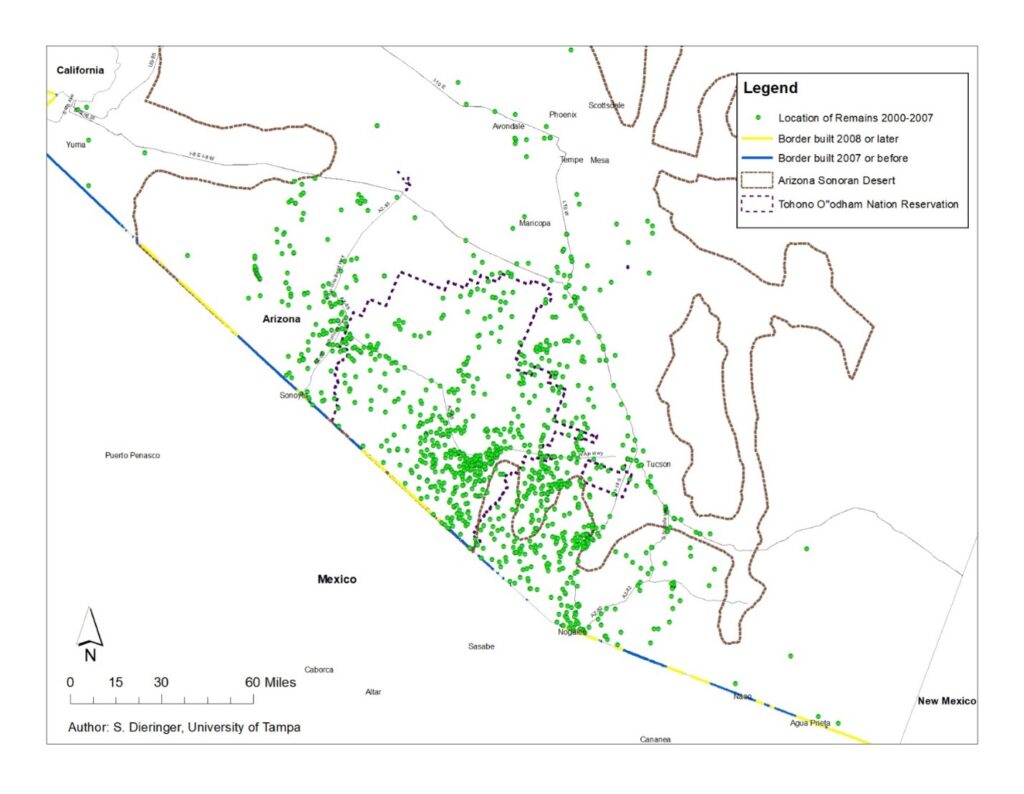
Figure 5. Migrant Deaths, 2008–2019
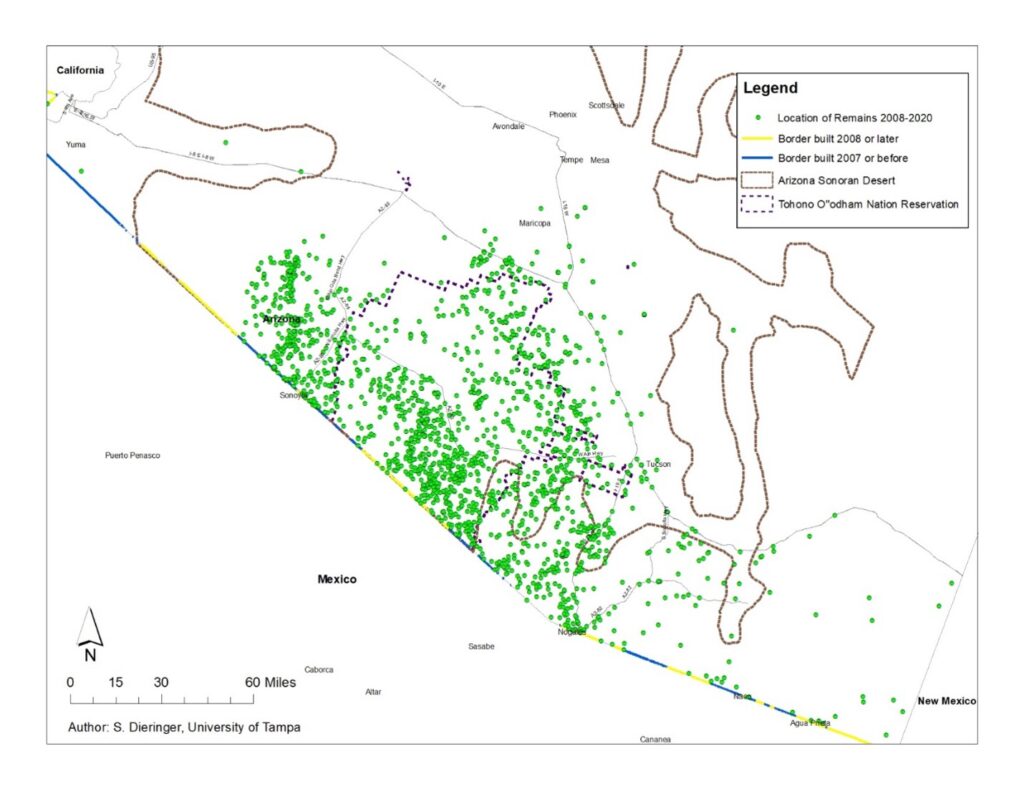
Figure 6. Hot-Spot Analysis, 2000–2007
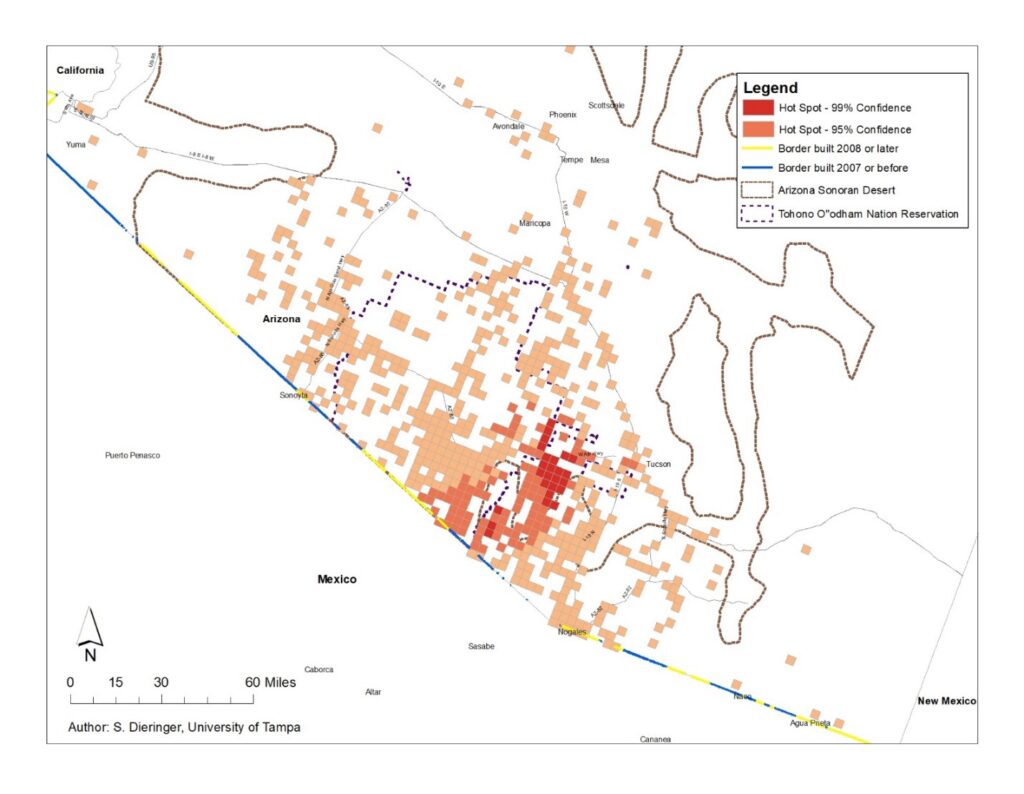
Figure 7. Hot-Spot Analysis, 2008–2019
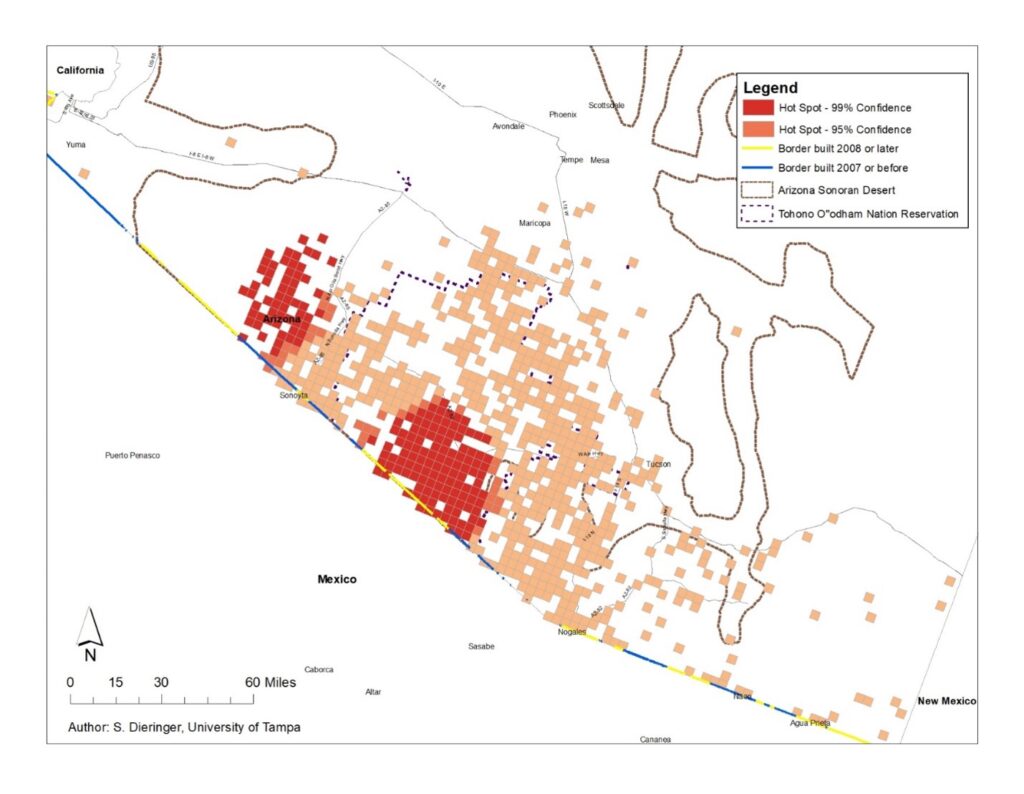
Figure 8. Danger Index and Hot Spots
References
Allen, T., Dobbin, C., and Morten, M. 2018. ”Border Walls.” NBER Working Paper 25267. National Bureau of Economic Research, Cambridge, MA.
American Immigration Council. 2021. “The Cost of Immigration Enforcement and Border Security.” https://www.americanimmigrationcouncil.org/research/the-cost-of-immigration-enforcement-and-border-security.
Bansak, C., Blanco, A.H., and Coon, M. 2022. “Border Fencing, Migrant Flows, and Crossing Deaths.” AEA Papers and Proceedings, 112: 381–385.
Beeferman, J. 2022. “Gov. Greg Abbott Redirects $500 Million from Other Agencies to Fund Border Security Mission through End of Fiscal Year.” The Texas Tribune, April 29. https://www.texastribune.org/2022/04/29/greg-abbott-texas-border-mission-funding/.
Bíl, M., Andrášik, R., and Sedoník, J. 2019. “A Detailed Spatiotemporal Analysis of Traffic Crash Hotspots.” Applied Geography, 107: 82–90.
Boyce, G.A., Chambers, S.N., and Launius, S. 2019. “Bodily Inertia and the Weaponization of the Sonoran Desert in US Boundary Enforcement: A GIS Modeling of Migration Routes through Arizona’s Altar Valley.” Journal on Migration and Human Security, 7(1): 23–35.
Castañeda, L., and Guerrero, J. 2017. “Decades-Long Struggle to Secure US–Mexico Border.” America’s Wall, November 13. https://www.kpbs.org/news/border-immigration/2017/11/13/americas-wall.
Chambers, S.N. 2020. “The Spatiotemporal Forming of a State of Exception: Repurposing Hot-Spot Analysis to Map Bare-Life in Southern Arizona’s Borderlands.” GeoJournal, 85(5): 1373–1384.
Chambers, S.N., Boyce, G.A., Launius, S., and Dinsmore, A. 2021. “Mortality, Surveillance and the Tertiary ‘Funnel Effect’ on the US-Mexico Border: A Geospatial Modeling of the Geography of Deterrence.” Journal of Borderlands Studies, 36(3): 443–468.
Cornelius, W.A. 2001. “Death at the Border: Efficacy and Unintended Consequences of US Immigration Control Policy.” Population and Development Review, 27(4): 661–685.
Coyne, C.J., and Hall, A.R. 2014. “Perfecting Tyranny: Foreign Intervention as Experimentation in State Control.” The Independent Review: A Journal of Political Economy, 19(2): 165–189.
Coyne, C.J, Hall, A.R., McLaughlin, P., and Zerkle, A. 2014. “The Hidden Cost of War: The Impact of Mobilizing Reserve Troops on Emergency Response Times.” Public Choice, 161(3): 289–303.
Coyne, C.J., and Hall, A.R. 2016. “Foreign Intervention, Police Militarization, and the Impact on Minority Groups.” Peace Review: A Journal of Social Justice, 28: 165–170.
Coyne, C.J., and Hall, A.R. 2018a. Tyranny Comes Home: The Domestic Fate of US Militarism. Stanford University Press, Stanford, CA.
Coyne, C.J., and Hall, A.R. 2018b. “War and Human Rights Abuses in the United States.” Peace Review: A Journal of Social Justice, 30(2): 184–191.
Eschbach, K., Hagan, J., and Rodriguez, N. 2003. “Deaths during Undocumented Migration: Trends and Policy Implications in the New Era of Homeland Security.” In Defense of the Alien, 26: 37–52.
Eschbach, K.J. Hagan, Rodriguez, N., Hernandez-Leon, R., and Bailey, S. 1999. “Death at the Border.” International Migration Review 33(2): 430–454.
Feigenberg, B. 2020. “Fenced Out: The Impact of Border Construction on US-Mexico Migration.” American Economic Journal: Applied Economics 12(3):106–139.
Filzen, A. 2013. “Clash on the Border of the Tohono O’odham Nation.” Pulitzer Center, February 22. https://pulitzercenter.org/education/clash-border-tohomo-oodham-nation.
Gambler, R.S. 2017. Southwest Border Security: Additional Actions Needed to Better Assess Fencing’s Contributions to Operations and Provide Guidance for Identifying Capability Gaps. GAO Report No. GAO-17-331. Government Accountability Office, Washington, DC.
García, U.J. 2022. “To Build Abbott’s Border Barrier, Texas Will Use Surplus Wall Panels from the Federal Government.” The Texas Tribune, February 15. https://www.texastribune.org/2022/02/15/texas-border-wall-federal-surplus-abbott/.
Getis, A., and Ord, J.K., 1992. “The Analysis of Spatial Association by Use of Distance Statistics.” Geographical Analysis, 24(3).
Getmansky, A., Grossman, G., and Wright, A.L. 2019. “Border Walls and Smuggling Spillovers.” Quarterly Journal of Political Science, 14(3): 329–347.
Giordano, A., and Spradley, M.K. 2017. “Migrant Deaths at the Arizona–Mexico Border: Spatial Trends of a Mass Disaster.” Forensic Science International, 280: 200–212.
Goodman, N.P. and Coyne, C.J. 2002. “US Border Militarization and Foreign Policy: A Symbiotic Relationship.” The Economics of Peace & Security Journal, 17(1).
Haddal, C.C., Kim, Y., and Garcia, M.J. 2009. Border Security: Barriers Along the US International Border. CRS Report No. RL33659. Congressional Research Service, Washington, DC.
Hall, A.R., Hassell, J.T., and Fitch, C.H. 2021. “Militarized Extremism: The Radial Right and the War on Terror.” The Independent Review: A Journal of Political Economy, 26(2): 225–242.
Hajela, G., Chawla, M., and Rasool, A. 2020. “A Clustering-Based Hotspot Identification Approach for Crime Prediction.” Procedia Computer Science, 167: 1462–1470.
Hanson, G.H., and Spilimbergo, A. 1999. “Illegal Immigration, Border Enforcement, and Relative Wages: Evidence from Apprehensions at the US-Mexico Border.” American Economic Review, 89(5): 1337–1357.
Humane Borders. n.d. “Arizona OpenGIS Initiative for Decreased Migrants.” https://humaneborders.info/.
Kim, D., Kim, M., and McNeely, N. 2020. “A Comparative Analysis of the Attitudes toward the US-Mexico Border Policy: Evaluating Perspectives on Border Security and Building a Wall in the Rio Grande Valley, National Hispanic and General US Populations.” Hispanic Journal of Behavioral Sciences, 42(4): 476–496.
Klopstock, S. 2022. “The Efficacy of US-Mexico Border Enforcement in Relation to Crime Prevention.” Themis: Research Journal of Justice Studies and Forensic Science, 10: 43–70.
Lee, M., and Khattak, A.J. 2019. “Case Study of Crash Severity Spatial Pattern Identification in Hot Spot Analysis.” Transportation Research Record, 2673(9): 684–695.
Martinez, D., Reineke, R., Rubio-Goldsmith, R., Anderson, B., Hess, G., and Parks, B. 2013. “A Continued Humanitarian Crisis at the Border: Undocumented Border Crosser Deaths Recorded by the Pima County Office of the Medical Examiner, 1990–2012.” Binational Migration Institute, University of Arizona.
Massey, D. 2017. “The Counterproductive Consequences of Border Enforcement.” Cato Journal, 37(3): 539–554.
Massey, D.S., Durand, J., and Pren, K.A. 2016. “Why Border Enforcement Backfired.” American Journal of Sociology, 121(5): 1557–1600.
Petutschnig, A., Havas, C.R., Resch, B., Krieger, V., and Ferner, C. 2020. “Exploratory Spatiotemporal Language Analysis of Geo-Social Network Data for Identifying Movements of Refugees.” GI_Forum, 1: 137–152.
Ratcliffe, J. 2010. “Crime Mapping: Spatial and Temporal Challenges.” In Handbook of Quantitative Criminology (pp. 5–24). Springer, New York, NY.
Rubio-Goldsmith, R., McCormick, M., Martinez, D., and Duarte, I. 2006. “The ‘Funnel Effect’ & Recovered Bodies of Unauthorized Migrants Processed by the Pima County Office of the Medical Examiner, 1990–2005.” Binational Migration Institute, University of Arizona.
Secure Fence Act. 2006. “Public Law 109-367.” https://www.govinfo.gov/content/pkg/STATUTE-120/pdf/STATUTE-120-Pg2638.pdf.
Sherwood, J.T. 2008. “Building the Wall: The Efficacy of A US-Mexico Border Fence.” Master’s Thesis. https://apps.dtic.mil/sti/pdfs/ADA502097.pdf.
US Census Bureau. 1994. “Estimates of Emigration of the Foreign-Born Population: 1980–1990.” Working Paper No. POP-WP009.
US Customs and Border Protection. 2020. “Border Patrol History.” https://www.cbp.gov/border-security/along-us-borders/history.
US Department of Justice. 2002. “An Investigation of Travel Reimbursements in Connection with the INS’s Operation Safeguard.” https://oig.justice.gov/sites/default/files/archive/special/0301/main.htm.
US Government Accountability Office. 2001. INS’ Southwest Border Strategy: Resource and Impact Issues Remain after Seven Years. GAO Report No. GAO-01-842. Washington, DC.
US Government Accountability Office. 2018. CBP Is Evaluating Designs and Locations for Border Barriers but Is Proceeding without Key Information. GAO Report No. GAO-18-614. Washington, DC.
Watson, T., and Thompson, K. 2021. The Border Within: The Economics of Immigration in an Age of Fear. University of Chicago Press, Chicago, IL.