Introduction
Labor market opportunities have long been recognized as a driving force in international students’ mobility, and empirical evidence on their movement to higher-income countries lends its support for this hypothesis (Suter and Jandl, 2006; Rosenzweig, 2008; She and Wotherspoon, 2013). Obtaining a degree from the United States is even more important for international students, who consider higher education as a bridge to longer-term employment in the country. However, one of the constraints in entering the labor force is the difficulty of obtaining a temporary employment visa—an H-1B visa—which is a nonimmigrant visa that allows firms in the United States to sponsor and employ workers to work in specialized occupations. When H-1B quotas became stricter in 2004, the Optional Practical Training (OPT) evolved to become an even more important channel for students to enter the labor market.
OPT is a temporary employment authorization that allows international students, or more accurately, students with an F-1 immigrant status, to work in a job that is related to their major (US Citizenship and Immigration Services, 2022). The key to this program is that international students can participate in the labor market without changing their nonimmigrant status. In 2008, the Department of Homeland Security (DHS) extended the OPT period from 12 months to an additional 17 months for students who earned a degree in STEM fields. The DHS designates programs to be considered STEM fields for the purposes of the OPT extension, and in 2012 it expanded the list of STEM fields to include more programs. In 2016, the extension for STEM graduates was further extended from the additional 17-month period to a 24-month period. International students now have up to three years to use the OPT.
Because of these changes, OPT has come under greater scrutiny. The extension of OPT for STEM graduates has prompted many debates, including a lawsuit that challenges its validity (Washington Alliance of Technology Workers v. US Department of Homeland Security, 2015) and a proposal by the previous Trump administration to suspend it. Proponents of stricter immigration policies argue that the program “increase[s] the number of economic competitors” and “expose[s] [domestic workers to] unfair competition,” (Washington Alliance of Technology Workers v. US Department of Homeland Security, 2015) while opponents contend that the OPT extension helps the United States remain competitive in the global market as employers face increasing difficulty recruiting and retaining high-skilled workers.
Additionally, from academic institutions’ perspectives, OPT has been an essential incentive for international students’ enrollment, and with falling enrollment in recent years, there is increased apprehension that restrictions on OPT will further affect enrollment (US Senate Committee on Health, Education, Labor, and Pensions, 2007). These discussions underscore the importance of understanding the implication of changes—whether it is expansion, restriction, or suspension—to OPT. Moreover, using administrative data from the Student and Exchange Visitor Information System, Demirci (2019) shows that approximately 72 percent of international students in his sample use their OPT after completing their degree, and the proportion is even higher for students who complete their degree in fields that are eligible for the OPT extension. While it is well documented that the extension increases the likelihood of international students staying in the United States, less is known on the impact of its extension on schooling choices.
In this paper, I consider how the OPT extension affects the schooling decisions of international students. Specifically, I evaluate how the extension affects the enrollment decisions of international students into STEM fields in the United States and whether it has an impact on degree completion.
This study aligns with several other studies that show how sensitive enrollment in academic institutions is to immigration policy (Kato and Sparber, 2013; Shih, 2016). Since the OPT extension also inadvertently causes a more open labor market, and given that international students’ enrollment decisions are highly responsive to the labor market climate, the extension can incentivize their enrollment in STEM fields (Bound et al., 2013).
Using exogenous variation in the timing of the OPT extension, I use a difference-in-differences approach to first compare the likelihood of international students enrolling in STEM fields before and after the extension. To account for the trend in labor demand for STEM graduates as well as general economic conditions for STEM occupations in the United States, I use domestic students as a control group. I also examine the change in the composition of international students who are induced to study STEM fields in the United States after the extension.
To implement the analysis, I use unique, administrative data from the state of Ohio that covers the universe of students enrolled in public higher education from 2004 to 2015. The longitudinal data follow multiple cohorts of students in each field of study, making it possible to track how academic outcomes evolve for individual students before and after the extension. I find that the OPT extension increases the likelihood of international students’ enrollment into STEM fields. In particular, there is a 1.8 percentage point (5.2 percent) increase in the enrollment into STEM fields for bachelor’s programs and a 0.6 percentage point (1.1 percent) increase for master’s programs. Doctoral programs see a smaller and statistically insignificant increase in the enrollment of STEM fields.
This study joins a small but growing strand of literature that examines the effect of OPT. Amuedo-Dorantes, Furtado, and Xu (2019) use multiple waves of National Survey of College Graduates to examine changes in the propensity of having a STEM degree. They document an overall increase of 18 percent in the propensity of holding a STEM degree for individuals who enter the United States with a student visa. Because of the nature of their data, their sample only includes college graduates who remained after graduation and are living in the United States at the time of the survey. As discussed by the authors, it is likely that in addition to the policy effect, part of the effect they find is mechanical due to the decrease in return migration among STEM graduates following the OPT extension. My study is complementary to theirs since I can directly observe international students while they are enrolled in school. This provides a more direct measure of the OPT extension for STEM degrees on international students’ major choice, especially among students who do not remain in the United States.
In a related study, using international students in non-STEM fields as their control group, Amuedo-Dorantes, Shih, and Xu (2022) examine the effect of the policy reform on the institutional totals of international students in STEM fields as well as the quality of the students. They find larger effects for enrollment into STEM fields as well. With their control group, they can account for the general trend that international students face. However, there is a concern that individuals in their control group are affected by the OPT extension as well. If international students who would have studied non-STEM majors are induced to study STEM majors after the extension, it can cause an upward bias. I provide an alternative approach in my study by using domestic students in STEM fields as a control group. In doing so, I circumvent the issue of substitution bias, which I also show is a potential threat with my results. This is not to say that the control group I use is without any limitations. Mixed evidence on the relationship between academic performance and immigrant share does not help rule out the possibility that international students crowd out domestic student in their enrollment (Betts and Lofstrom, 2000; Orrenius and Zavodny, 2015; Shih, 2017; Anelli, Shih, and Williams, Forthcoming).
Another concern is that domestic and international students might not be perfect substitutes in the labor market and may compete for very different occupations or industries. However, international students who are induced to enroll in STEM fields are likely motivated by the increased labor market opportunity in the United States. These individuals are also likely candidates for H-1B employment after their OPT ends. Since employers who recruit H-1B workers must take necessary steps to recruit domestic workers for those positions, it implies that international students and domestic students are close substitutes for the labor market.
My findings are also subject to some qualifications imposed by the scope of my data. Because all the institutions I study are Ohio public universities, my results do not reflect how international students may be drawn to other states in the United States, and the effect of the OPT extension may induce more significant changes to enrollment and completion in those places. As shown in both closely related studies, Amuedo-Dorantes, Furtado, and Xu (2019) and Amuedo-Dorantes, Shih, and Xu (2022), the authors find a larger effect of the OPT extension on enrollment. While I do not face issues like a decrease in return migration and substitution bias, the results from my analysis may not be generalized to the whole nation. That said, it is reassuring that the estimated effect for Ohio is smaller than the effect found for the whole nation. Additionally, the academic institutions in Ohio, which include very selective universities and less selective universities, do provide a close representation of the landscape in the United States. Furthermore, while California and New York host the most international students in the United States, Ohio ranks eighth in the country for states with the most international students (Duffin, 2023).
My study also extends on Amuedo-Dorantes, Shih, and Xu’s (2022) study in examining student quality. They use types and amount of financial aid received as well as selectivity of the attended institutions as proxies for student quality. They find that students are more likely to receive external funding and enter more selective academic institutions. Like them, I do not have information on preenrollment indicators on quality (i.e., SAT or GRE scores). However, I can capitalize on the individual- and term-level information on GPA provided by my data. Using first-term GPA as the next best measure for students’ academic quality, I find that, after accounting for school quality and other school differences, the average quality of international students who study STEM fields in the undergraduate program is lower after the extension, while the average quality is higher for those in graduate programs. I further differentiate my study from previous research by examining international students’ responses to the OPT extension when DHS expanded the list of STEM fields to include more programs in 2012. Consequently, my study provides the first evidence of international students substituting from existing STEM fields into newly added STEM fields that qualify for the OPT extension in later years. Among those who substitute, they are in the left tail of the ability distribution.
While the change in policy induces an increase in enrollment into a STEM program, it is less clear what the completion rate is like. Several studies in the literature on college completion stress the role of uncertainty and show that learning about schooling ability has accounted for college attrition (Altonji, 1993; Arcidiacono, 2004; Altonji, Arcidiacono, and Maurel, 2016; Arcidiacono, Aucejo, and Hotz, 2016). In addition to the typical risk of overestimation in ability, there could potentially be a mismatch between international students and STEM programs. The mismatch hypothesis posits that individuals who enroll in academic institutions because of affirmative action will be adversely affected if their academic preparedness is lower than the rest of the typical cohort (Sander, 2004). Even though the OPT extension is not equivalent to an affirmative action and does not affect academic institutions’ admission decisions, it does affect students’ decision to apply to programs that they might not necessarily consider before the policy reform, much like recipients of affirmative action. Given that studies have shown mixed evidence on the mismatch hypothesis depending on the context on which it is tested (Cortes, 2010; Arcidianoco, 2012; Arcidianoco, 2016; Bleemer, 2022), it is important to test how the OPT extension affects beneficiaries’ rates of completion in STEM degree programs.
To study the impact on completion rates in STEM degree programs, I leverage the same exogenous variation to estimate the effect of the OPT extension on international students’ probability of completing a STEM degree program. Even though international students who enroll in STEM fields after the extension are, on average, of lower ability, I find that there is a higher probability of completing a bachelor’s degree by year three after the extension: a 0.7 percentage point (5.9 percent) increase. The increase in the completion rate comes from an increase in the hazard rate of completion in year three after enrollment. There is also a 1.3 percentage point (7.6 percent) and a 3.4 percentage point (11 percent) increase in completion rates (by year two and year five) for both master’s degrees and doctoral programs, respectively. Overall, I find an estimated positive effect of the OPT extension on the likelihood of enrolling and completing a STEM degree program. The increase in enrollment in response to the OPT extension suggests that international students place a large value on having a longer work experience in the United States after graduating. These results lend a better understanding on how labor market outcomes affect their major choice.
In addition to factors such as expected earnings (Arcidiacono, Aucejo, and Spenner, 2012; Arcidiacono, Hotz, and Kang, 2012; Beffy, Fougere, and Maurel, 2012; Wiswall and Zafar, 2015), ease of labor market entry is also another dimension that students consider. Additionally, given the growing importance of STEM fields, this study relates to the literature that examines determinants of STEM participation and retention (Ehrenberg, 2010; Kokkelenberg and Sinha, 2010; Rask, 2010; Wang, 2013; Sovero, Buchinsky, and Baird, 2021). Within the literature, there is a strand that studies the participation of underrepresented groups in STEM. Those various factors range from school research budgets (Griffith, 2010) to the presence of role models (Hoffmann and Oreopoulos, 2009; Price, 2010; Bostwick and Weinberg, 2018) to grade sensitivity (Ost, 2010). In contrast, this study focuses on the international student population and considers immigration policy as a determinant for participation and persistence in STEM majors.
Institutional Background
International students who attend an academic institution in the United States have several options after they graduate. First, they can leave the country. Second, they can transfer to another academic program to continue their studies or can change to a different nonimmigrant status. Last, students can use their OPT. The last option is a 12-month training period that allows international students, or, more accurately, students with an F-1 nonimmigrant status, to enter the labor market without changing their nonimmigrant status. The employment, however, must relate to their field of study. Even though they can also use OPT (precompletion) during their educational program, I focus on OPT (postcompletion) that students use after they graduate from their respective institutions.
To enter the labor market, international students can use the second option and acquire an H-1B status. With an H-1B visa, students can work up to three years with the option to be extended to a maximum of six years at the sponsoring firm.1While workers using H-1B visas have a maximum of six years at the sponsoring firm, they can stay on by switching their status from an H-1B worker to being a permanent resident if the firm also successfully sponsors their green card application for them. Also, note that higher education institutions, nonprofit organizations, and government research organizations are exempt from the annual cap. However, obtaining an H-1B visa is not without its challenges. In addition to finding an employer that is willing to sponsor their H-1B petition, there is an annual visa cap and visas are awarded on a lottery basis when oversubscribed. Since OPT does not require a change in academic status to participate in the labor market, international students have had a significant barrier to employment removed. The value of the feature is even more apparent for both international students and employers when Congress opted not to extend the increase in H-1B visas in 2004.2When Congress opted not to extend the increase in H-1B visas, the annual allocation became 65,000 H-1B visas and an additional 20,000 for workers with advanced degree from the United States. Since then, the H-1B cap has been often binding every year and the program is oversubscribed. For instance, the filing period, which begins on April 1 before the start of each fiscal year on October 1, has been reached significantly earlier each year. In fact, for fiscal year 2008, the cap was reach on April 2, 2007—the first business day for filing, and the U.S. Citizenship and Immigration Services (USCIS) actually received more than twice the number of the approved cap. Once the filing period is closed, USCIS will then randomly select from the petitions that were filed during the acceptance period. OPT, on the other hand, does not have a cap on the number of approvals nor does it require sponsorship by employers. Individuals on OPT can switch to any employment as long as it is related to their field of study. Simply put, OPT provides an opportunity to obtain working experience in the United States without having to undergo the H-1B petition and its nuances.
The opportunity—for on-the-job experience, training, and professional networks—would serve as an invaluable experience for a new graduate, especially for international students who want to secure long-term employment in the United States. The 12-month period can be used to find a better match with employers as students can also gain firm-specific training, making them a better candidate for employers to sponsor them for an H-1B visa. Analogously, firms can use OPT as a screening period for international students before committing to the process of sponsorship. On April 8, 2008, when the OPT period was extended from 12 to 29 months for STEM fields, both the opportunity for work experience and the window for transitioning lengthened significantly for STEM graduates. Students can now work up to 29 months, and for those whose H-1B petition are not selected, they can remain at their current employment and their employers can file their petition for as long as their OPT is valid. This provides a time buffer for international students to be able to continue in employment until their H-1B petition is selected. Depending on when the students graduate, STEM graduates have multiple chances to submit their petition.
On May 11, 2012, the DHS expanded the list of STEM fields to include more majors. All the fields that qualify for the STEM OPT extension involve “research, innovation, or development of new technologies using engineering, mathematics, computer science, or natural sciences (including physical, biological, and agricultural sciences)” (Homeland Security Department, 2021). Students who graduate from fields like “econometrics and quantitative economics” and “pharmaceutical sciences” now qualify for the 17-month extension as well. For the sake of clarity in this paper, I classify the fields of studies into three categories—traditional STEM fields, newly added STEM fields, and non-STEM fields—in which students can complete their degree. The classification follows how the DHS designates degree programs into STEM fields. Majors that are designated by the DHS as STEM fields before 2012 are categorized as traditional STEM fields, while majors that are included as STEM fields in 2012 are categorized as newly added STEM fields. All majors excluded from the list of STEM fields are then non-STEM fields. In 2016, the OPT extension for STEM graduates changed from 17 months to an additional 24 months.
Conceptual Framework
As discussed in the previous section, there are many benefits to the OPT extension for international students who wish to enter the labor market in the United States, such as the increase in the length of time to obtain training and the probability of securing both long-term employment and a working visa. Given the change in the benefit of obtaining a STEM degree from the United States, theory predicts that enrollment into a STEM degree program should increase. There are two margins in which students will be induced to study this degree in the United States, and depending on which margin is more responsive to the policy change, the average quality of international students changes accordingly.3I adapt Kato and Sparber’s (2010) theoretical model of international students’ migration decision when considering international students who apply to schools in the United States to study STEM fields based on the perceived labor market prospects upon graduation.
The first margin is made up of students who would have studied STEM fields in other countries but are induced to study in the United States after the 2008 extension. The 2008 extension can increase quality if low-ability STEM international students have a very low probability of finding permanent employment even without the extension. Hence, the low-ability students are not induced by the extension to enter the United States, and the OPT extension would only have an effect on high-ability students. One the other hand, the extension could decrease quality if low- STEM international students now see it as an opportunity for longer firm-specific training, which would make them a better candidate for permanent employment. In this case, these low-ability students are induced to apply to the United States, lowering the average ability of international students studying STEM fields. On this margin, the effect of the extension on average ability of international students in STEM fields is ambiguous.
The second margin consists of international students who would have studied non-STEM majors in the United States and are now induced to study a STEM field. There is an unambiguous decline in the average quality of international students studying STEM for this margin after the extension. Individuals differ in STEM ability, and occupations differ in wage premiums. Studies have shown that undergraduate degrees are concentrated in particular occupations and there are heterogeneity in earnings across fields (Black, Sanders, and Taylor, 2003; Ransom and Phipps, 2010; Altonji, Kahn, and Speer, 2014). Following the canonical Roy model (1951), individuals select their field of study based on their individual expectation of their own abilities and characteristics of the labor market. If all else is equal, high-ability STEM international students would then select into STEM fields since there is a higher wage premium in STEM-related occupations.
Furthermore, when the OPT period was extended for STEM graduates, it induced non-STEM international students who are in the higher distribution in STEM ability to select STEM fields. Even though the marginal students who are induced to select into traditional STEM majors are positively selected from non-STEM fields, the average ability of marginal students is lower than the average ability of international students, who are the always takers of STEM fields. This leads to a decrease in the average ability of international students in STEM fields. While I am unable to differentiate between the two margins of international students who would be induced to pursue a STEM degree after the extension, this thought experiment provides an important framework as I analyze international students’ selections into different types of STEM fields.
To expand on the discussion on the selection into different types of STEM fields, I use the classification of the field of study—traditional STEM fields, newly added STEM fields, and non-STEM fields—which I have introduced in the previous section. When the DHS expanded the list of designated STEM degree programs in 2012 to include fields that rely heavily on analytical and quantitative skills (but are otherwise listed as non-STEM fields before 2012), it follows that newly added STEM fields are positively correlated with traditional STEM fields in STEM skills. For example, within the broad category of economics, “econometrics and quantitative economics,” which requires a stronger application of mathematical and quantitative skills, is the only major selected to be included as STEM fields over other majors like “economics, general” or “development economics and international development.” This would imply there is a higher complementary in STEM skills between newly added STEM fields like “econometrics and quantitative economics” and traditional STEM fields compared to a non-STEM field like “English language and literature.” Hence, it follows that international students who would have otherwise chosen to study fields such as “pharmaceutical sciences” as well as “econometrics and quantitative economics” (that were still listed as non-STEM fields in 2008) would be prime candidates to select into traditional STEM fields when OPT was extended in 2008.
Given that the additional fields that qualify for the OPT extension provide comparable marginal benefits to students, it is important to consider how this reform can potentially change students’ behavior. Similar to the earlier discussion, the margins in which students will be induced to study newly added STEM fields are (1) students who have studied newly added STEM field in other countries but are induced to study in the United States after the extension and (2) students who would have studied a non-STEM field in the United States but are now induced to study a newly added STEM field. However, there is a third margin to consider. When the fields (newly added STEM fields) qualified for the OPT extension in 2012, marginal students who would have been induced to select a traditional STEM field would then substitute back to these fields. This means that students who were prime candidates for the 2008 extension and would have otherwise chosen fields like “econometrics and quantitative economics” will now substitute to those fields when they quality for the extension in 2012. In my analysis, I distinguish between traditional and newly added STEM fields to examine the potential substitution of international students from traditional STEM fields into newly added fields that qualify for the OPT extension. I also account for the composition change of international students after the extension. I then test for change in the distribution of the ability of international students in the different fields.
While the enrollment rate for traditional STEM programs should increase after the OPT extension, its effect on the degree completion rate is unknown ex-ante. Even if individuals weigh the costs and benefits before choosing field of studies that maximize their welfare, they can only decide based on their expectation of their abilities, and there is always a risk of overestimation as well as the potential mismatch in inherent ability and field of study as previously discussed. Coupled with the potential change in the ability distribution of international students in STEM fields (both traditional and newly added STEM fields), the effect of the OPT extension on the level of realized rate of completion in STEM degree programs is ultimately an empirical question.
Data
My main source of data is a unique, administrative data set on higher education enrollment from the state of Ohio, which is made available to researchers by the Ohio Education Research Center.4The Ohio Longitudinal Data Archive (OLDA) is a project of the Ohio Education Research Center (oerc.osu.edu) and provides researchers with centralized access to administrative data. The OLDA is managed by the Ohio State University’s Center for Human Resource Research (chrr.osu.edu) in collaboration with Ohio’s state workforce and education agencies (ohioanalytics.gov), with those agencies providing oversight and funding. For information on OLDA sponsors, see http://chrr.osu.edu/projects/ohio-longitudinal-data-archive. The nature of the administrative data set provides a large sample size and detailed information about individuals. This includes international students who enroll in undergraduate and graduate programs at one of the 13 public four-year universities in Ohio. Because there was a structural policy change in H-1B, I restrict the data to students who enroll in years after 2004. International students who choose to study in the United States after 2004 are potentially different from the students who study in the United States before the implementation of the visa caps, and this could potentially confound the estimates.
The sample includes data of students enrolled from 2004 to 2015. The data include information on students’ demographic characteristics such as year of birth, gender, race/ethnicity, and citizenship status. They also include term-level information on admissions, enrollment, program of study, and credentials earned. Because my analysis also considers the length of time and the pathway of the student’s education, I restrict my sample to first-time degree-seeking students for their level of education. In particular, for undergraduate students, I do not consider transfer students, and for the PhD program, I do not consider master’s students who continue on in the same institution for their doctoral degree after obtaining their graduate degree.5Typically, graduate students who continue to pursue a doctoral degree after obtaining their master’s complete the program sooner than the typical student who enters the program as a doctoral student. Note that these students will still be in the sample for the master’s program. The sample is then drawn from 806,422 first-time degree-seeking students.
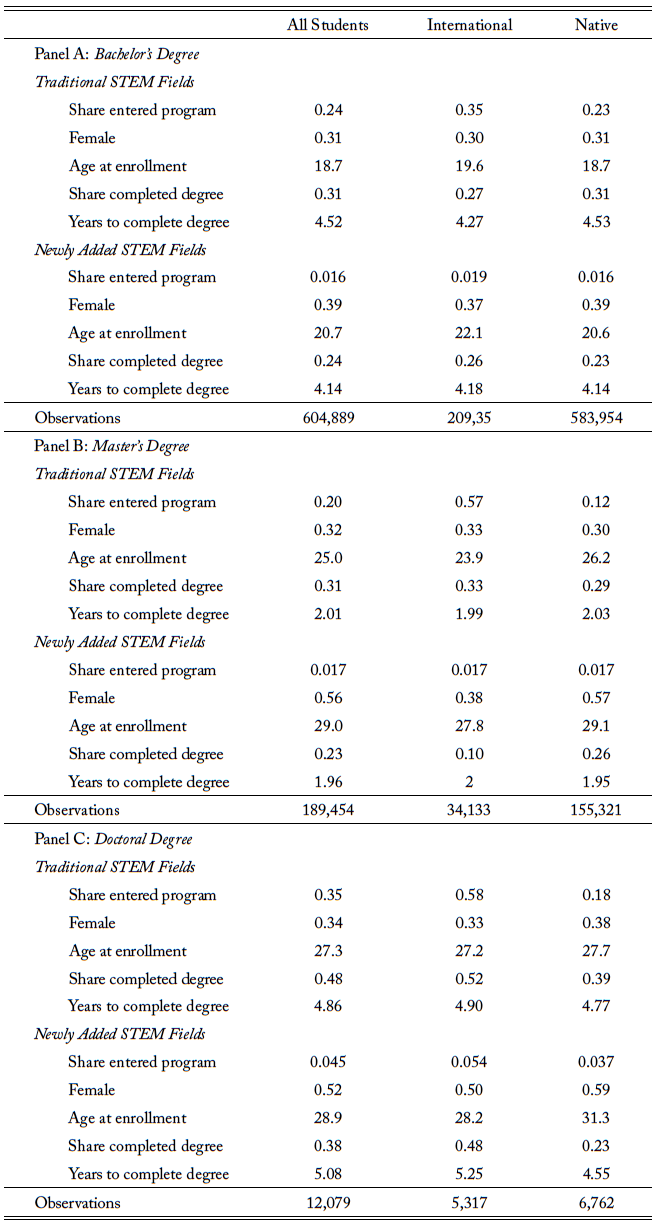
To study enrollment into traditional or newly added STEM fields, I indicate the field of studies that individuals enroll into in their first term in graduate programs. As for undergraduate programs, I define an indicator variable for whether the student ever declared a traditional or newly added STEM field throughout their schooling period. For my analysis on enrollment, I use person-level data, where the outcome of interest is an indicator of students’ enrollment into STEM fields. This approach provides the averages of enrollment rates in STEM fields. Table 1 shows the basic descriptive information on the analysis sample, and each panel shows the characteristics for different levels of degree. Panel A shows the sample for students in the bachelor’s program sample, which makes up 75 percent of the total sample, while panels B and C show the sample for students in the master’s degree and doctoral program sample, which consists of 23.5 percent and 1.5 percent of the total sample, respectively.
Across the degree levels, there are mostly more female domestic students enrolled compared to international students. International students also tend to be older than domestic students in the undergraduate level, but that relationship switches at the graduate level. Table 1 also indicates the share of students entering traditional STEM and newly added STEM fields for the different level of programs. It is not surprising that international students make up a larger proportion of students enrolling in traditional STEM fields, and the share is even more significant in the graduate program. However, it is interesting that the share of international students is more comparable in newly added STEM fields for both bachelor’s and master’s programs. Another important point to note about the low rate of completion rate is that the sample is drawn from students who enroll from 2004 to 2015. The seemingly low rate of completion is driven by students who enroll in later years and may not have completed their degree rather than by a high dropout rate.
While the estimated averages for enrollment rates is useful for reporting and policy purposing, using the same strategy to examine completion rate sometimes mask the dynamic nature of the education process as well as the importance of understanding the path toward degree completion (Singer and Willett, 1993, 2003). Since I can observe each individual student each term starting from their enrollment year, I track students’ dropout and graduation occurrence. In doing so, I can provide a better understanding of international students’ path toward completing their STEM degree program using this person-period-level data. The unit of observations for my analysis to study the completion of degree is the schooling spell for each student enrolled in a program, with the outcome of interest an indicator for whether that spell ended during the time period under observation. The schooling spell ends when the student completes their chosen degree—a traditional STEM, newly added STEM, or non-STEM—for their program level; I denote this schooling spell as “Tenure.”
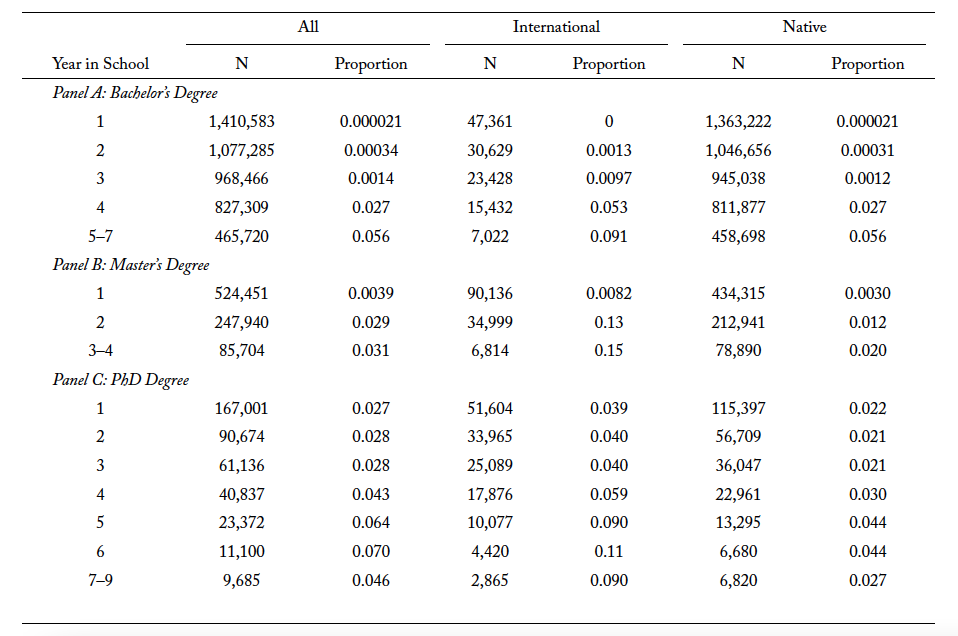
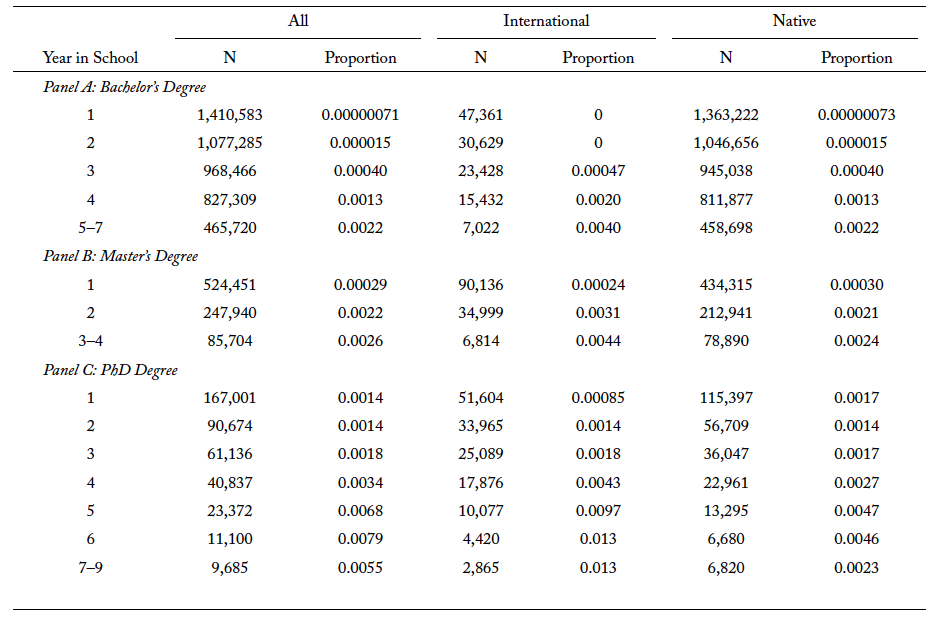
Each student has a separate record in each year of their tenure in school before completing their degree. For example, a student who completes their traditional STEM degree in four years from the time of enrollment would have four separate records of “Tenure,” where each record of “Tenure” would have the value of one to four, respectively. The first three records of “Tenure” (row 1–3) will have “0” associated with the outcome of interest and “1” for the fourth row of “Tenure.” If students begin a new program after completing their initial degree, I consider them to be a new unit of observation. Tables A1 and A2 show the proportion of students who complete traditional and newly added STEM degrees, respectively, by each year since enrollment for all program levels.
Empirical Approach
To identify the causal impact of the OPT extension on enrollment into traditional STEM fields, I use a difference-in-differences strategy where I exploit the random timing of the OPT extension. Specifically, I estimate a model of the following form:
(1)
where reflects enrollment into major field
that is categorized as a traditional STEM field
for student
at school
in year
.
is an indicator variable for being an international student (has an
visa status), while
is another indicator variable equal to one if the OPT extension has been passed during year
of student
‘s enrollment. The interaction term
is the interaction between the international student dummy and the posttreatment dummy. As previously discussed, because of the high complementary in skills between traditional and newly added STEM fields, I account for the possibility of students being drawn away from STEM fields to newly added STEM fields when they qualify for the extension in later years. Like
,
is an indicator variable, but it is equal to one if student
is enrolled in year
when the newly added STEM field qualifies for the OPT extension. By including
and
, I account for the possibility of international students being drawn away from traditional STEM fields to newly added STEM fields.
I control for individual-level characteristics such as age at enrollment and gender, which are represented by the vector . To account for differences across fields as well as unobserved field-specific changes over time, I include both field fixed effects,
, and field-by-year fixed effects,
. I do the same to alleviate the concern of differences in school quality and unobserved school-specific changes over time by including school fixed effects,
, and school-by-year fixed effects,
.6There may be a concern that with many high-dimensional fixed effects included simultaneously, there would be insufficient remaining variation in the enrollment of students into different fields. For example, when the model includes field fixed effects, it controls for differences across fields such as the difficulty level that is constant for every field. When field-by-year fixed effects are included, it accounts for unobserved field-specific changes over time such as the increasing popularity of computer science over time. However, this is not an issue in practice because there are many idiosyncratic forces determining the enrollment choices of both international and domestic students. The coefficient of interest is
, which shows the difference-in-differences estimates of the OPT extension’s effect on enrollment in traditional STEM fields.
The ideal experiment to identify the OPT extension’s impact would be to randomly assign the extension to international students. Without the random assignment in the OPT extension for students, this model uses domestic students as the counterfactual group. The key assumption of this strategy is that both international and domestic students would follow the same time trend in absent of the treatment and would have parallel trends in their decision to major in and complete traditional STEM degrees and newly added STEM degrees in the absence of the OPT extension in 2008. Even if this policy extension is a result of increased demand from the science and tech industries, there are no reasons to think that international and domestic students would be responding differently to the labor demand before the OPT extension. To test for this assumption, I plot an event study to examine the pretrends for both the control and treatment group for each level of programs.
To study completion, I use the longitudinal aspect of the data set to map out the effect of the policy extension throughout students’ schooling spell in a program. To analyze how the policy extension affects students’ enrollment in the school from one year to the next, I estimate the equation below:
,
where is an indicator variable for whether student
completes a major
that is categorized as a STEM field
at school
in year
.
specifies the separate record in the time period
that student
is at risk of completing the outcome of interest. As specified before,
is an indicator variable for being an international student, and
is the interaction term for
and
is an indicator variable equal to one if the OPT extension is in effect while student
is in matriculation in year
.7For example, a student who is enrolled in year 2006 and remains enrolled in year 2009 would have Post08t’=0 for year 2006 and 2007 and Post08’ = 1 for year 2008 and 2009.
is then the interaction term of
and
, while
is the interaction term of
,
, and
. By including
and
, I account for the possibility of international students being drawn away from STEM fields to newly added STEM fields.
Like equation 1, I control for individual-level characteristics, . Because there are differentials in the gender and age of international and domestic students who choose to pursue STEM fields as shown in table 1, I also include an interaction of
with being an international student, defined by
. I include both field fixed effects,
, and field-by-year fixed effects,
, to account for differences across fields as well as unobserved field-specific changes over time. I also include field-by-international student fixed effects,
, to account for the types of international students in different fields. I do the same to alleviate the concern of differences in school quality, unobserved school-specific changes over time, and selection of international students into different schools by including school fixed effects,
, school-by-year fixed effects,
, and school-by-international student fixed effects
.
This approach allows me to compare the pre- to post-2008 change in the probability of completing a traditional STEM degree program for international students, conditional on them being in school the year before. This is otherwise known as the change in the hazard rate, which is captured by the coefficient of interest, . Because
is estimated for every school period, it shows the change in the probability of completing a traditional STEM degree program in tenure
, conditional on the student enrolled in school in tenure
. In other words, I estimate the impact of the OPT extension on international students’ hazard rate of completing a traditional STEM program relative to domestic students. The approach is thus a difference-in-differences hazard model. In addition to measuring the impact of the OPT extension, it also allows me to assess of how the policy affects the cumulative probability of completion and facilitates decomposing the total probability of completion into a series of persistence probabilities at each year of one’s program.
This analysis also relies on the assumption that the OPT extension is not correlated with any other unobservable influencing the graduation rate for international students. An example of a violation of this assumption might be the appointment of a department faculty to recruit international students into STEM fields while enacting other changes to improve the new international students’ outcomes (but not those international students who already chose the STEM major). However, the possibility of faculty members enacting changes that would improve outcomes only for new entrants but not for students who have already chosen STEM is highly unlikely, especially since faculty members would not be able to differentiate between students who would always choose STEM majors and those who are induced to choose the major.
In my conceptual framework, I discuss the potential difference in the quality and types of international students who are induced by the policy extension to enroll in academic institutions in the United States to pursue a STEM degree. To examine this hypothesis, I estimate equation 2 including an interaction of school-by-year fixed effects with the international student status, . If
from equation 2 does not change with the inclusion of
, then it implies there is no change in the types of students. However, if changing the quality of students is positively correlated with the probability of completing a STEM degree program, then there will be an upward bias in the estimated
from equation 1. Analogously, if lower-ability students are induced to enter the program, then I would have underestimated the size of the effect in
.
As a further test, I employ a difference-in-differences approach in examining the effect of OPT extension on the average quality of international students in STEM fields. Since I do not have information on preenrollment indicators on quality (i.e., SAT or GRE scores), I use first-term GPA as the next best measure for students’ academic quality. I use the same specification in equation 1 to compare the average academic quality of international students who enroll in academic institutions in the United States for STEM degree programs before and after the extension. The model specification is as follows:
where reflects the first-term GPA for student
at school
in year
. Again, I control for individual-level characteristics such as age at enrollment and gender, which are represented by the vector
. Like equation 1, I include both field fixed effects,
; field-by-year fixed effects,
; school fixed effects,
; and school-by-year fixed effects,
. The coefficient of interest is
, which shows the difference-in-differences estimates of OPT extension effect on first-term GPA.
Results
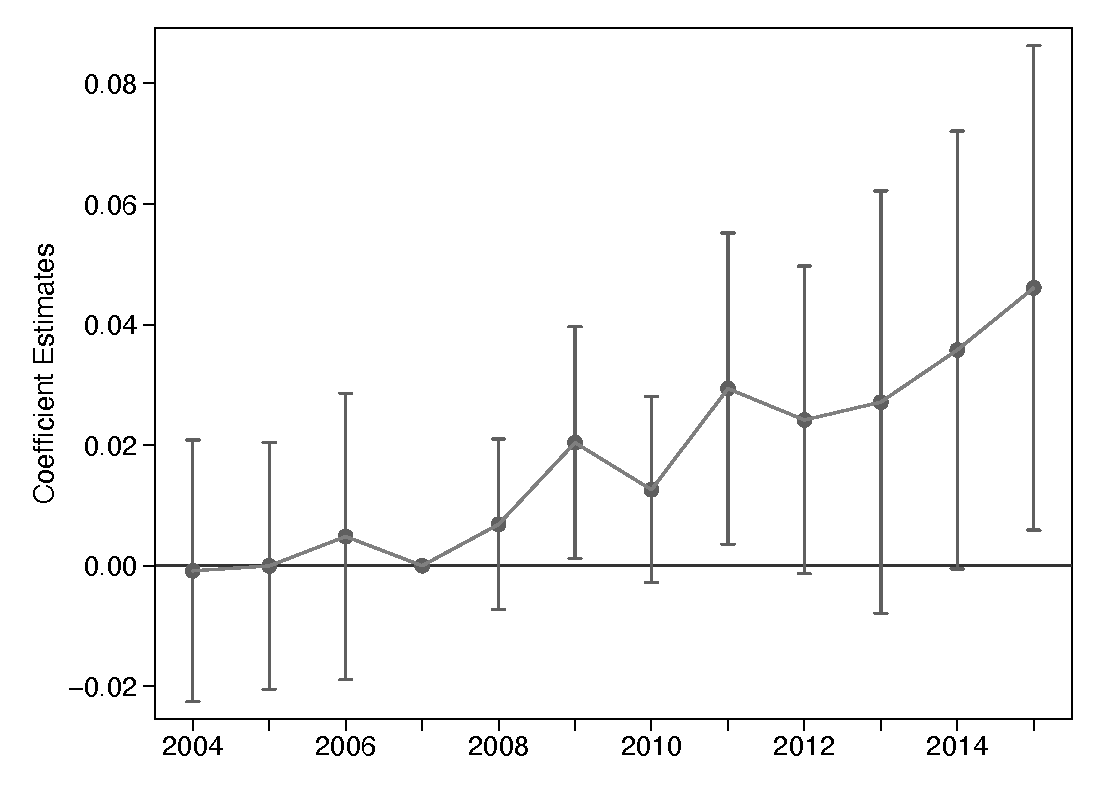
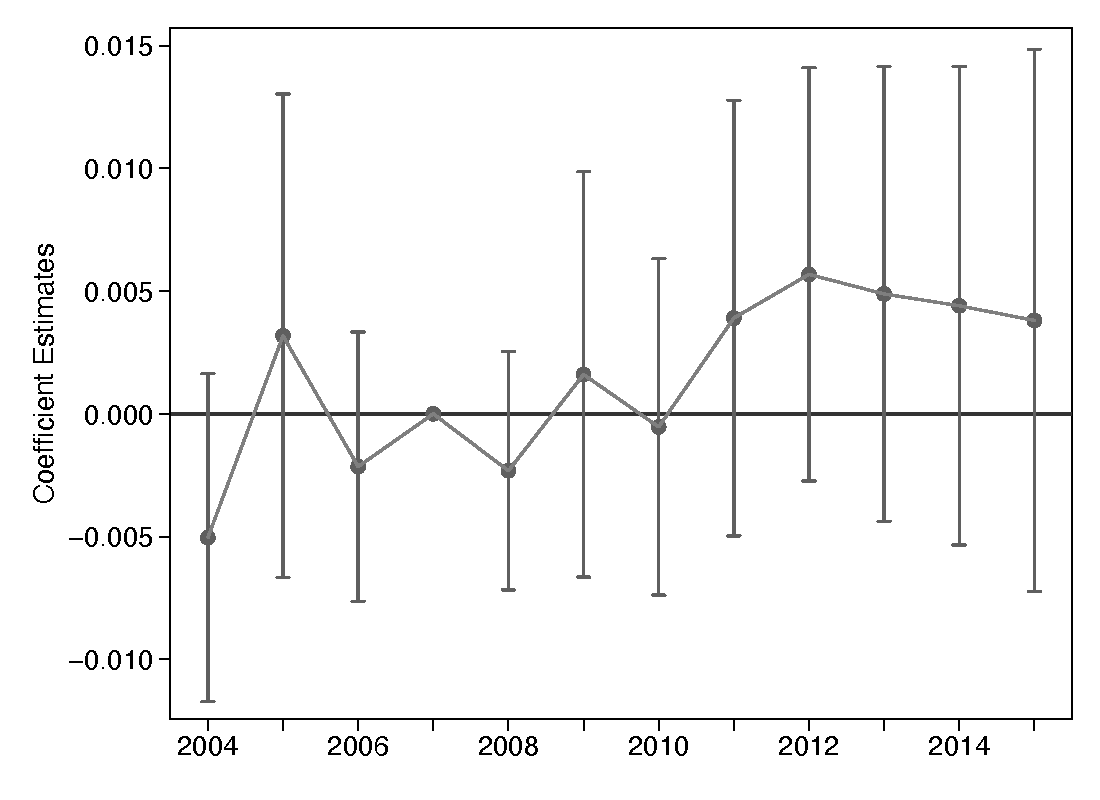
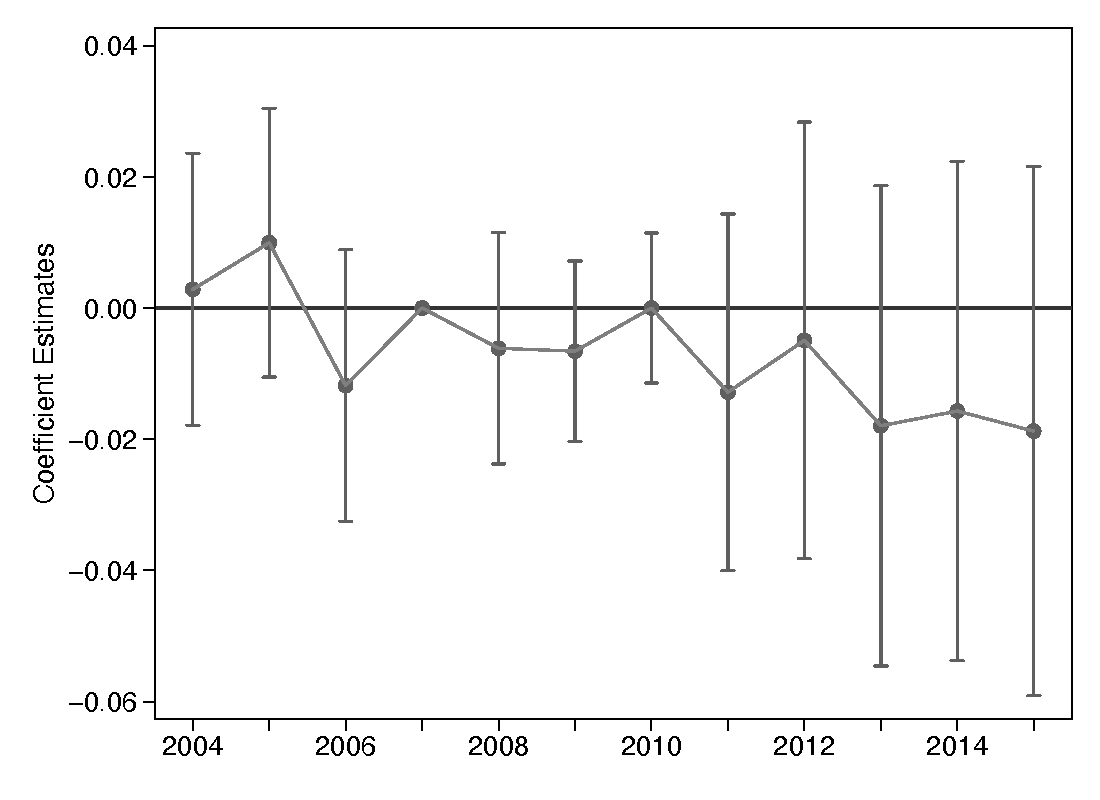
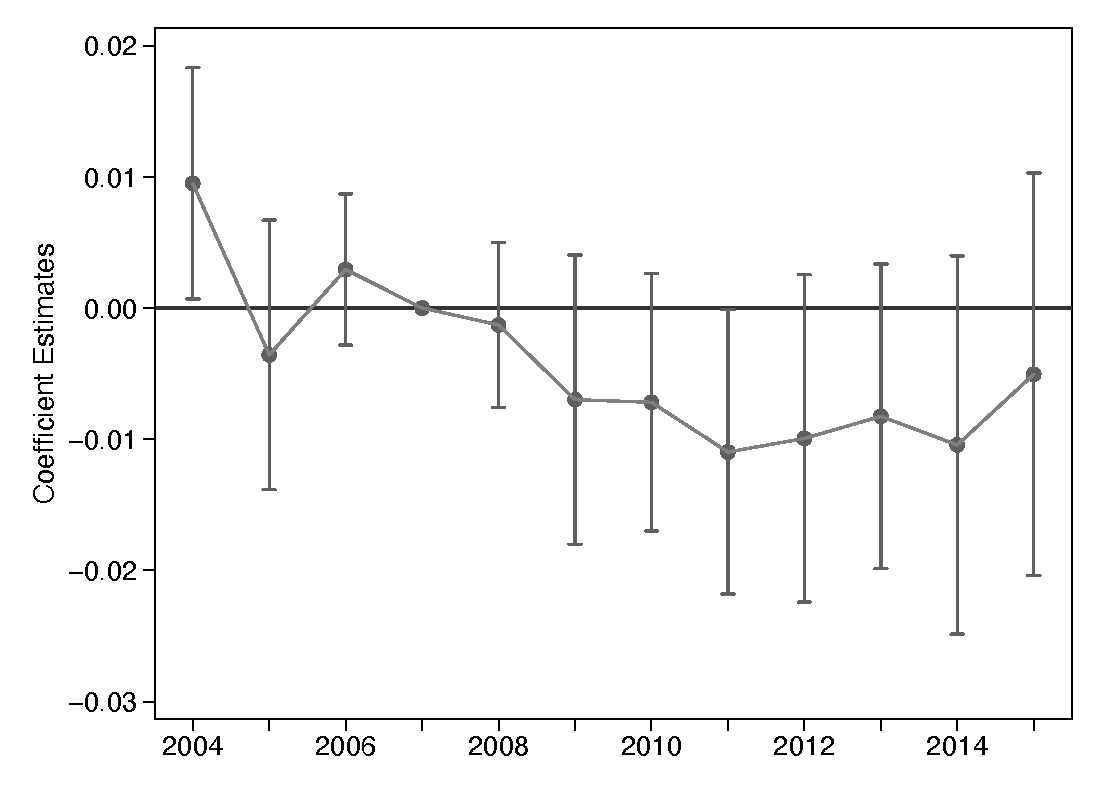
Before discussing the results from equation 1, I will present the event study that examines the difference-in-differences estimates for the probability of enrolling in a traditional STEM degree program by year for each level of program. Figure 1, panel (a) shows the event study for bachelor’s degrees. The omitted year for these analysis is the year 2007, one year before the policy is in place. It is reassuring that the plots from the first five years leading up to the policy in 2008 are close to zero. This indicates that the pretrends for both the control and treatment group are very similar. Figure 1, panels (b) and (c) show the event study for graduate programs, but the figures look to be a little imprecise to have a clear understanding of the effect of the OPT extension.
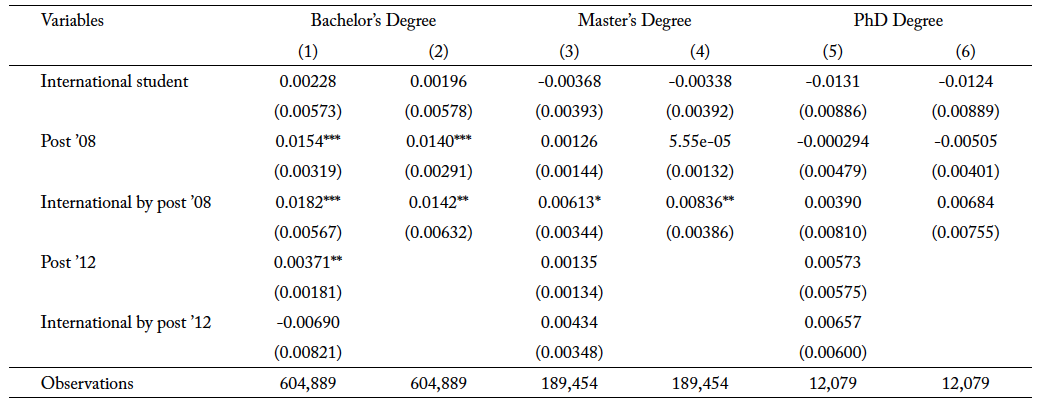
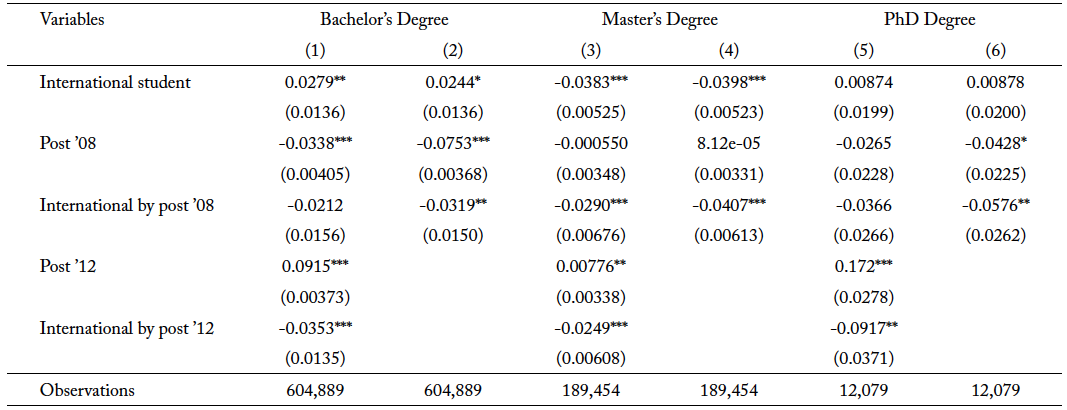
Table 2 presents the estimated effect of the OPT extension on the probability of international students’ enrollment into traditional STEM fields. The coefficient of interest for “International by post ’08” in column 1 is estimated from the model specification in equation 1 for bachelor’s degrees. There is an increase of 1.8 percentage points (5.2 percent) in the enrollment into traditional STEM fields for international students after the extension. To examine the potential substitution from traditional STEM fields into newly added STEM fields when they qualify for the OPT extension, I estimate equation 1 without accounting for the policy change in 2012 in column 2. When comparing the coefficient of interest for “International by post ’08” in columns 1 and 2, it is interesting to note that the coefficient is larger in magnitude in column 1 than in column 2. The change in the magnitude of coefficient suggests that international students in the undergraduate level are substituting away from traditional STEM majors to newly added STEM majors when the fields qualify for the extension in 2012.
In column 3, the result shows a positive increase in the enrollment of international students in the master’s program. Specifically, there is an increase of 0.6 percentage points (1.1 percent) in the enrollment into traditional STEM fields for international students after the extension. The coefficient for “International by post ’08” in column (5) shows there is a 0.3 percentage point (0.5 percent) increase in enrollment for PhD programs, but it is statistically insignificant. Although the results suggest there is a positive increase in the enrollment of international students in the graduate programs, I do not observe a similar change for international students in the substitution to newly added STEM majors when they quality for the extension. This may be because it is more difficult to switch fields at the graduate level. The results, however, are statistically insignificant, and I do not have the precision for any conclusive inferences.
Amuedo-Dorantes, Furtado, and Xu (2019) examine the effect of the OPT extension on the propensity of holding a STEM degree for individuals who first enter the United States with a student visa. They document about a 4 percentage point increase (10.2 percent), though statistically insignificant, for bachelor’s degrees and a statistically significant increase of 16 percentage point (33 percent) for master’s degrees. My finding is similar in direction of the effect, but my point estimates are much smaller. There are a few theoretical possibilities of why my findings differ, which the authors discuss as well. First, their results are subject to selective outmigration. Because they focus on a selected sample of international students, they cannot distinguish if the extension induces students to study STEM fields or if it just enables STEM degree graduates to prolong their stay in the United States while on their student visa, which can explain the much larger effect found. Because my data include information on students’ choices while they are still enrolled in school, I avoid such concerns. Surprisingly, they find a negative effect of 20 percentage points (50 percent) on the likelihood of doctoral graduates to hold a STEM degree.
The second reason could be the control group they use in their analysis. Their comparison group are individuals who enter the United States with a permanent visa or working visa (H-1B) before returning to pursue higher education. It is important to note that individuals with a permanent visa do not face similar constraints when searching for employment, where they are essentially considered as domestic. More importantly, individuals who enter with a H-1B visa are legally required to switch to a student visa to enroll in an academic institution, which would underestimate any effect found. This could be the reason why they find a negative effect of the doctoral program, while I find a positive effect.
The different control group used in Amuedo-Dorantes, Shih, and Xu (2022) could also potentially explain the difference in point estimates. Their specification uses international students in non-STEM fields (primarily business majors) as their control group. Again, it is reassuring to find that my results are similar in terms of direction, but they also find a larger effect than mine. Their result shows that the OPT extension increases international student enrollments in bachelor’s programs by 18 percent and master’s programs by 30 percent. The difference in my findings is not surprising as different control groups are being used. However, as discussed by the authors and also evidenced by my findings, there is a concern of substitution from non-STEM majors to STEM majors as a response to the policy reform. This could lead to an upward bias in their estimates. While the authors minimize such concerns by primarily using international students in business majors as their control group, part of the magnitude of their results could potentially still be attributed to international students in business majors substituting into STEM majors.
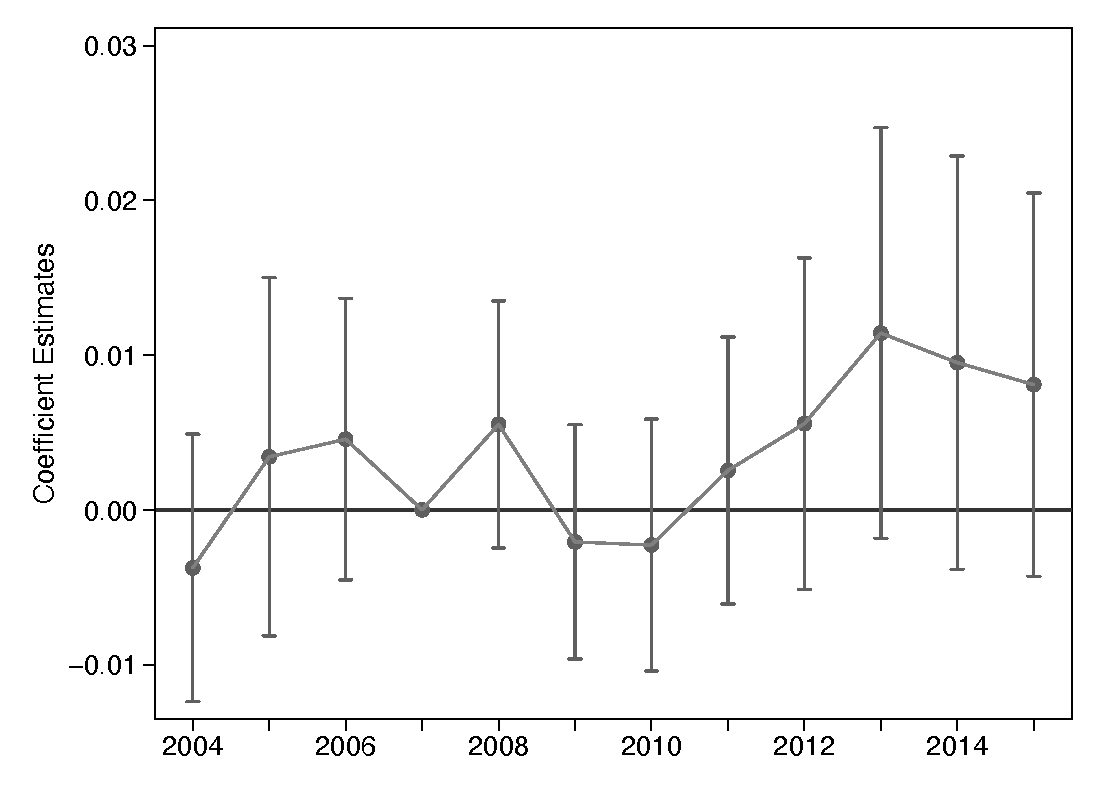
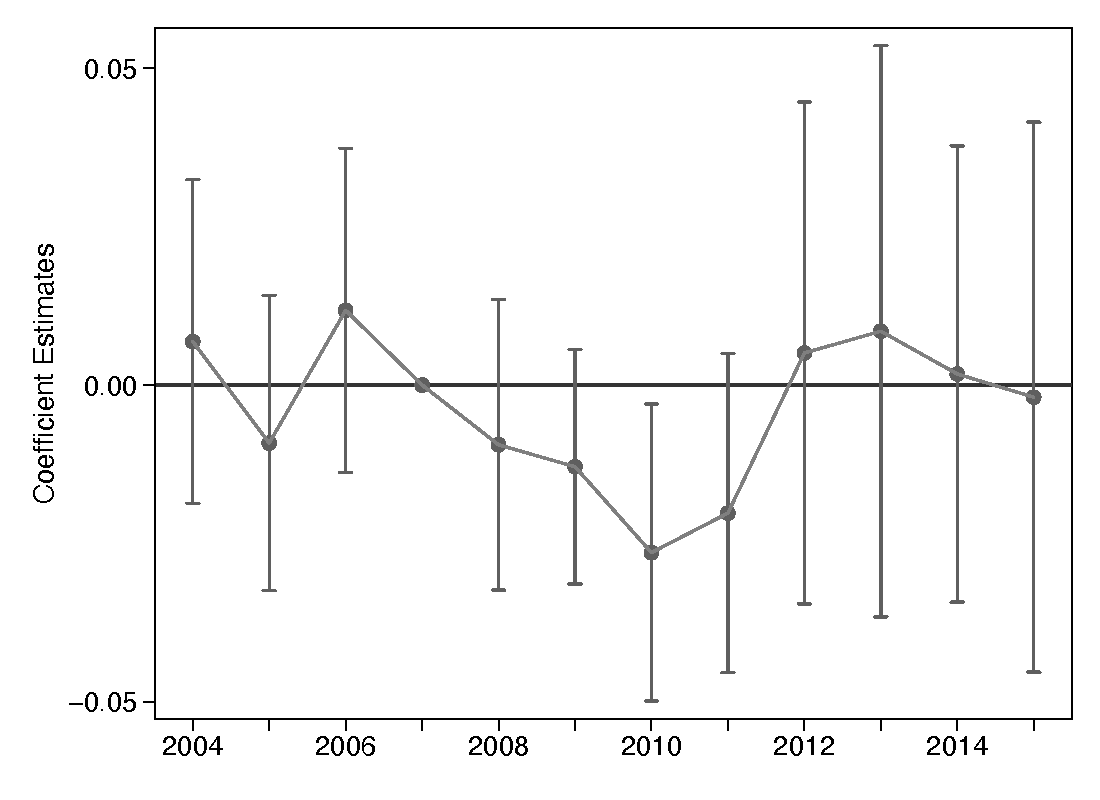
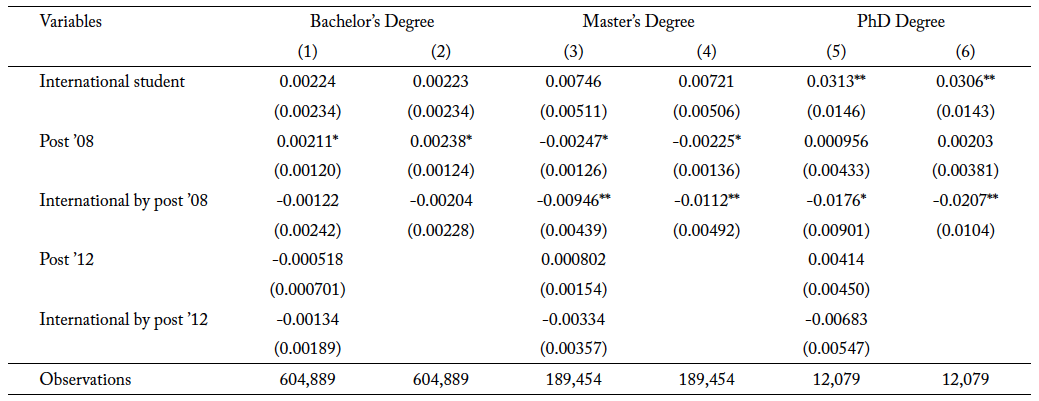
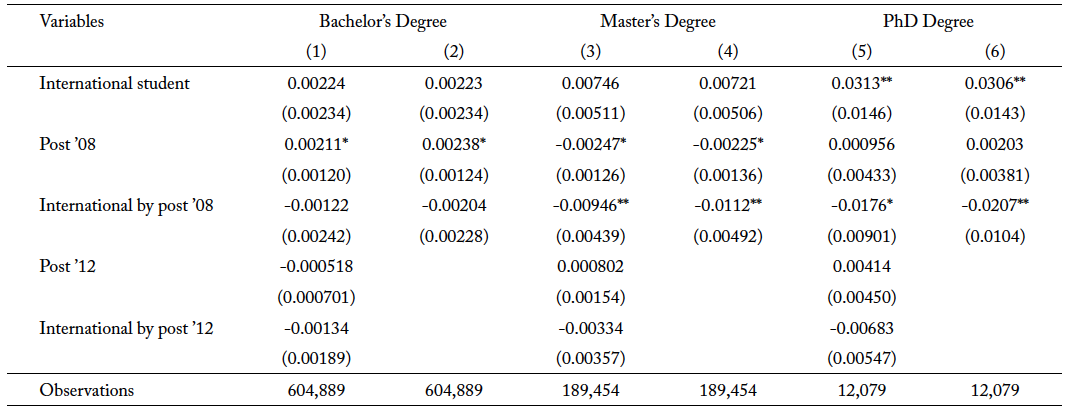
Since the results in table 3 provide some evidence of international students in the undergraduate level substituting into newly added fields when they qualify for the OPT extensions in 2012, I further test this hypothesis by estimating the effect of the OPT extension on enrollment into newly added STEM fields using the same specification in equation 1. Given that newly added STEM fields do not qualify for the extension in 2008, I do not expect any positive estimates for “International by post ’08.” The results for the estimation for bachelor’s, master’s and PhD programs are shown in table 3, and as expected, the coefficients for “International by post ’08” are all nonpositive in magnitude. Even though the coefficients on “International by post ’12” are not statistically significant to reject that the effect is different from zero, a visual inspection of figure 2 provides some suggestive evidence of an overall upward trend for enrollment into newly added STEM fields after 2012, especially for bachelor’s degrees as shown in panel (a).
Effects of OPT Extension on the Completion of STEM Program
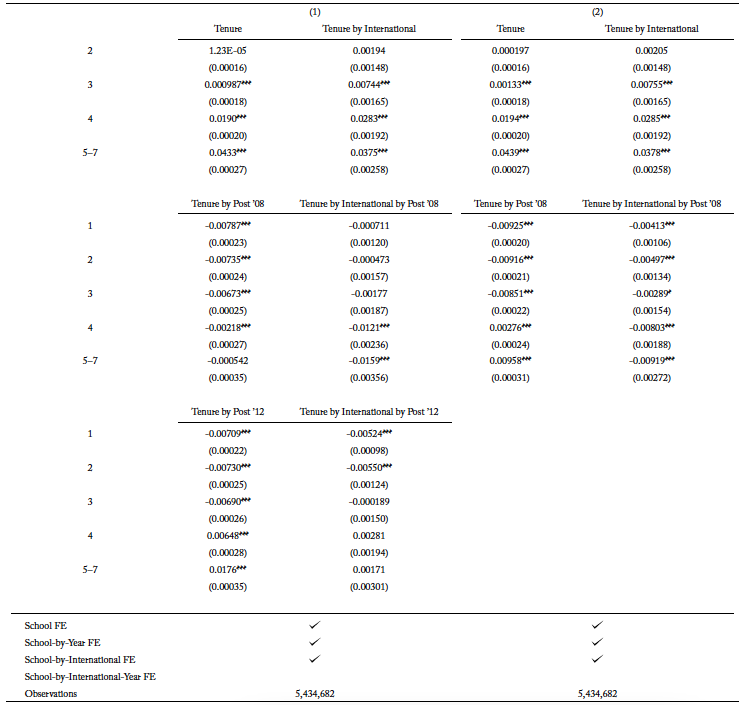
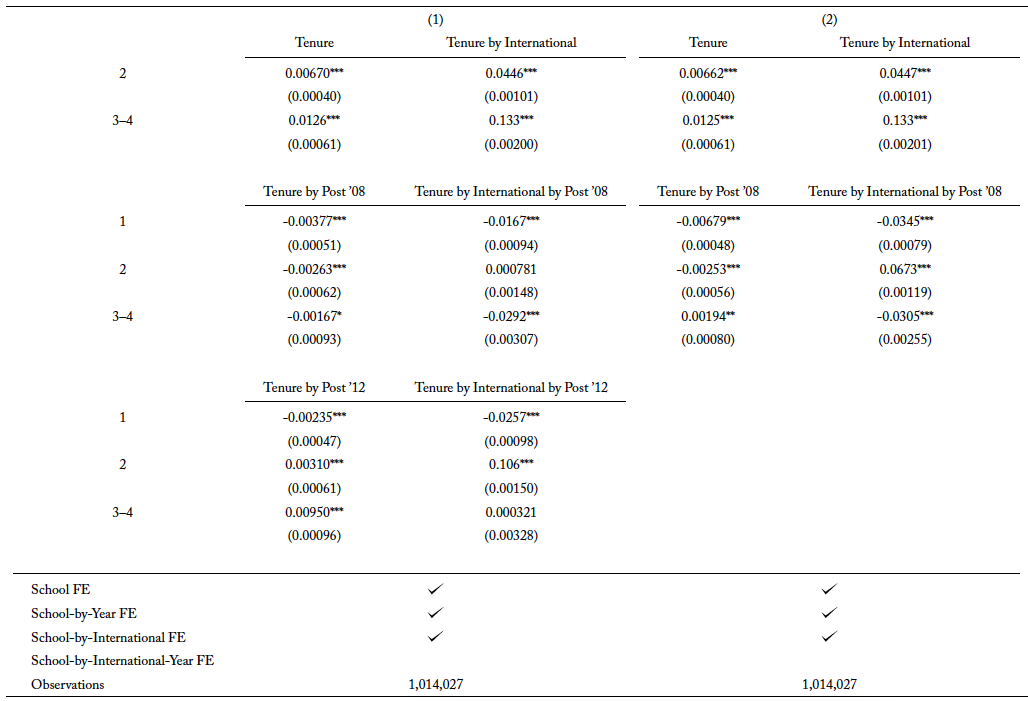
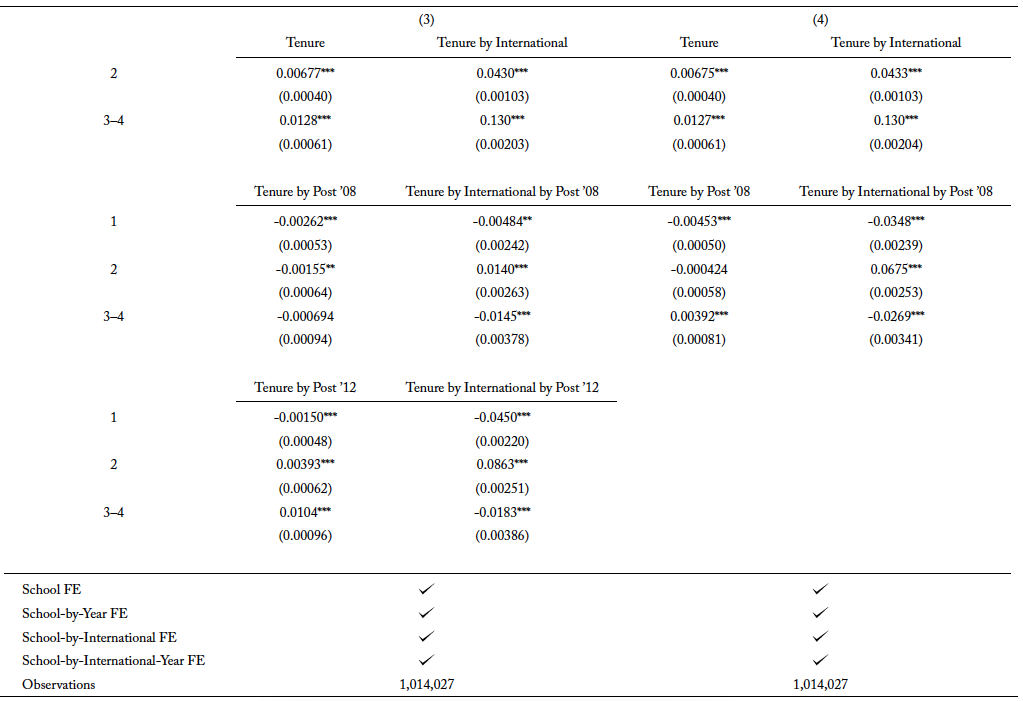
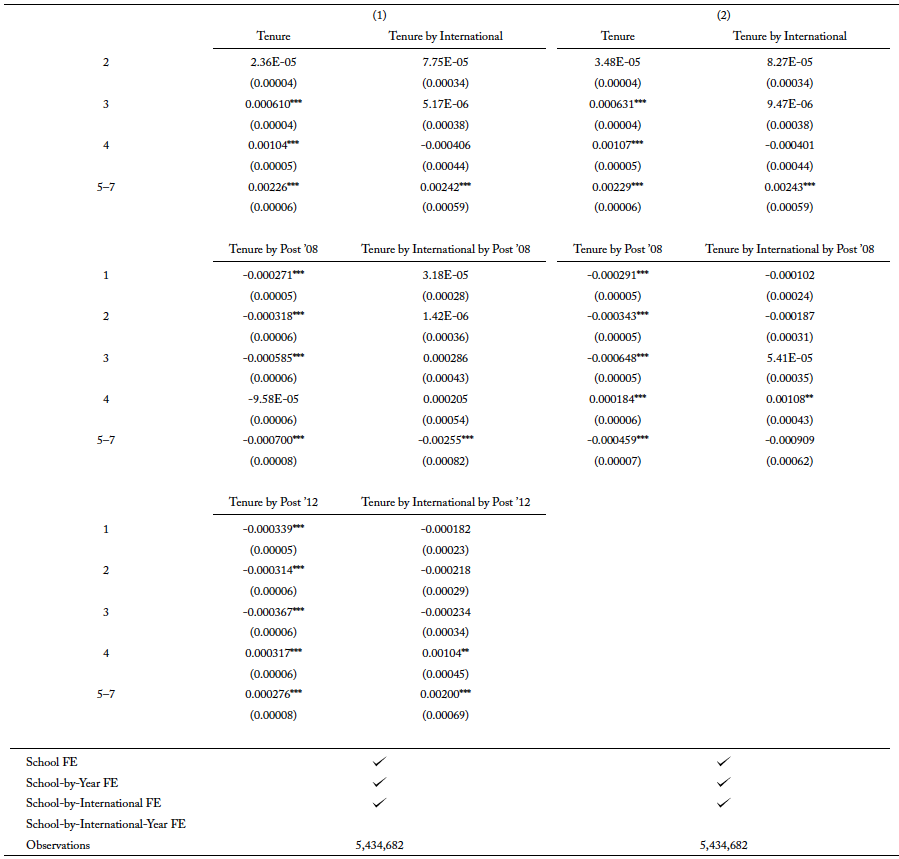
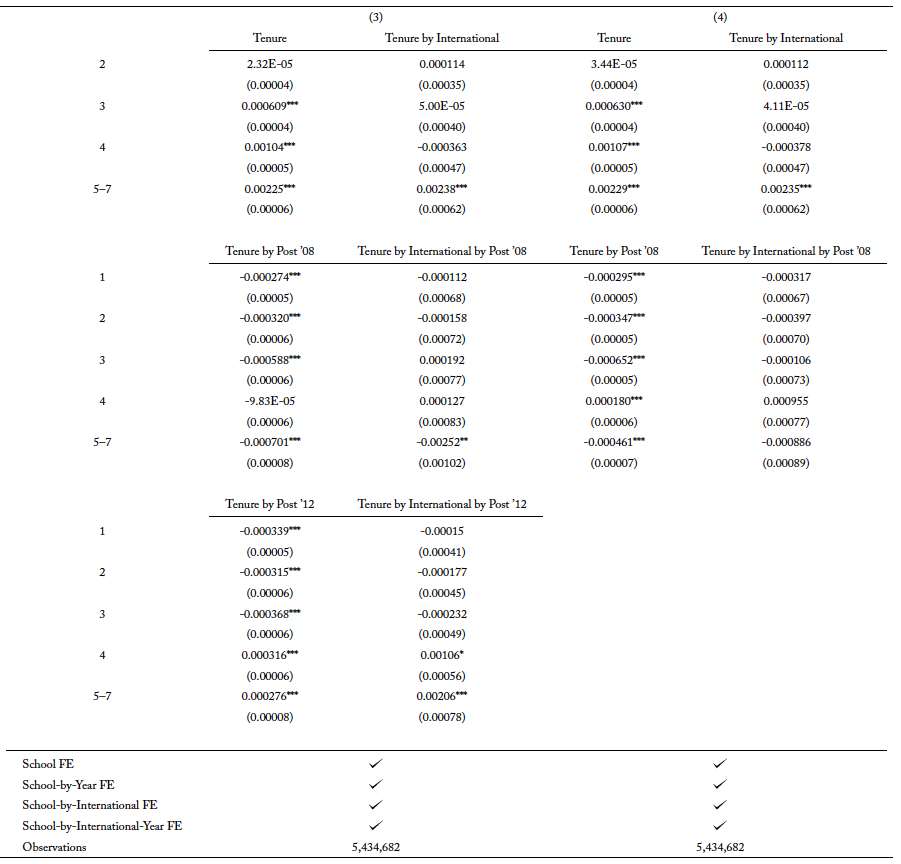
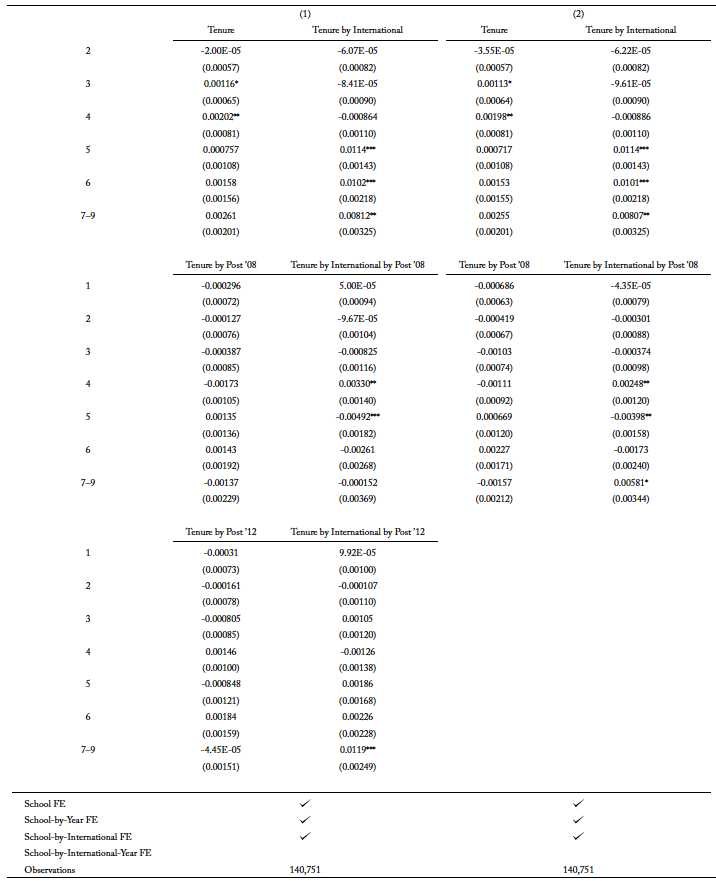
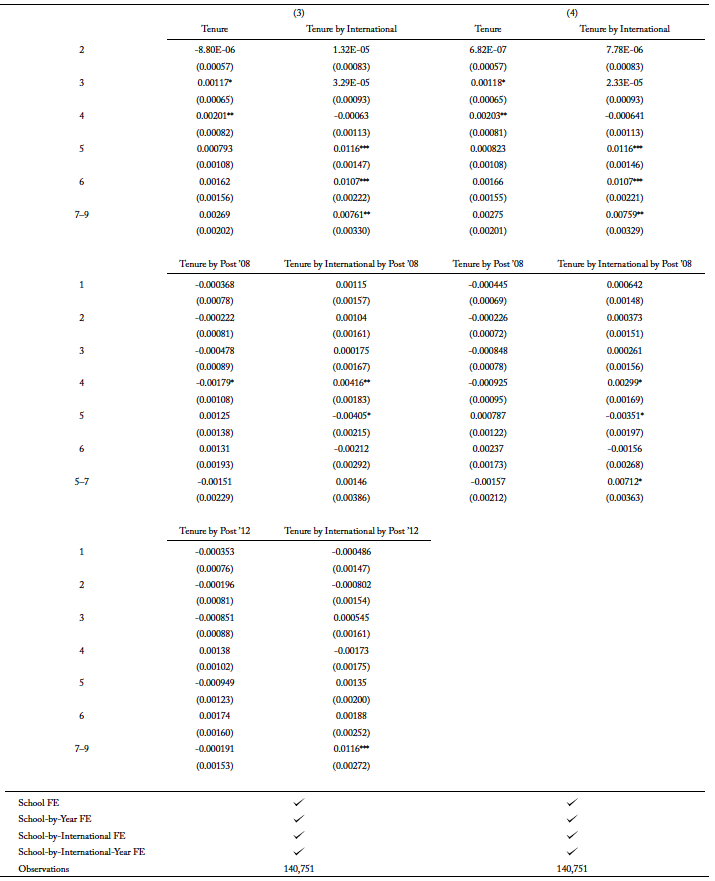
The evidence on compositional changes for the types of international students in traditional STEM fields is more apparent when examining the results for completion in these fields. More importantly, I can exploit the rich longitudinal aspect of the data set to study the pathway to degree completion for international students. Table 4 presents the effect of the OPT extension on the hazard rate of completing traditional STEM degree programs for international students in the undergraduate level. Namely, the coefficients of “Tenure by international by post ’08” in column 1 show the difference-in-differences estimates of the probability of completing a traditional STEM major in each respective tenure, conditional on international students not declaring the major the year before.
To fully understand the dynamics of substitution into newly added STEM fields, I also estimate equation 2 without accounting for the policy change in 2012. Table 4, column presents the results. International students in undergraduate programs have a negative risk of completing a traditional STEM degree program throughout their schooling years after the extension. In column 1, the hazard rate is slightly less negative when the effect of newly added fields qualifying for OPT extension is accounted for. A less negative, or, analogously, a more positive, hazard rate in column 1 implies that the risk of completing a traditional STEM degree program is larger when compared to column 2. When newly added STEM majors qualify for the extension in 2012, international students substitute to those fields. Since the remaining students are the ones who are more likely to complete their degree compared to those who substituted, this suggests that lower-ability international students are substituting into newly added STEM major when the fields qualify for the extension in 2012.
In columns 3 and 4, I explore the possibility of a compositional change in the types of international students who enroll in academic institutions after the extension. These columns are analogous to columns 1 and 2, but they are estimated with an inclusion of school-by-international-by-year fixed effects to allow for the differential effect for international and domestic students by the school and year of enrollment. The estimates for “Tenure by international by post ’08” in columns 3 and 4 become more positive compared to columns 1 and 2, and they also differ from each other in the same direction as columns 1 and 2, whereby the estimates in column 3 is more positive than column 4. I focus on column 3 as it is the most comprehensive in its controls. Relative to domestic students, international students have a slightly higher risk of completing their traditional STEM degree programs after the extension in 2008.
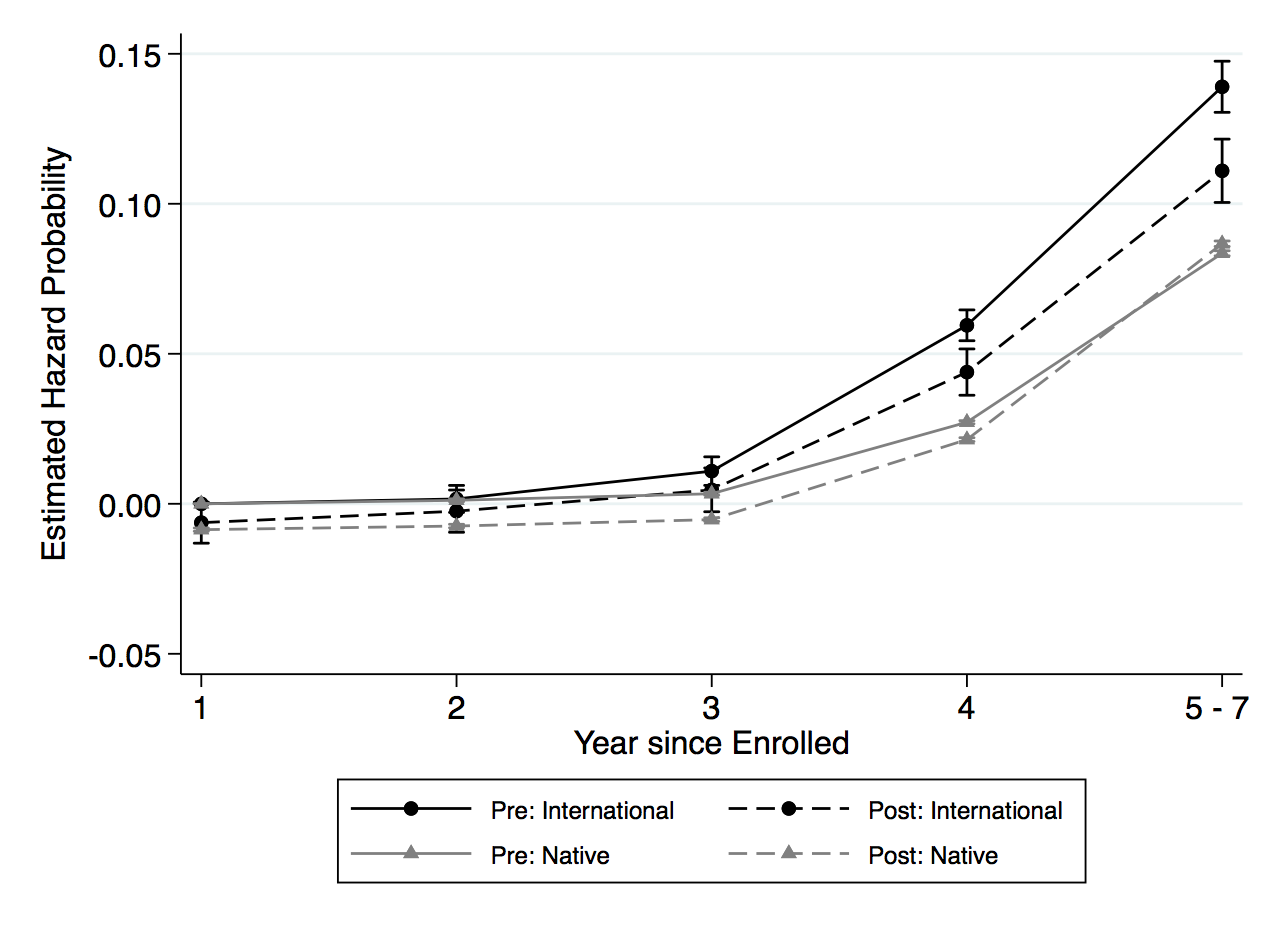
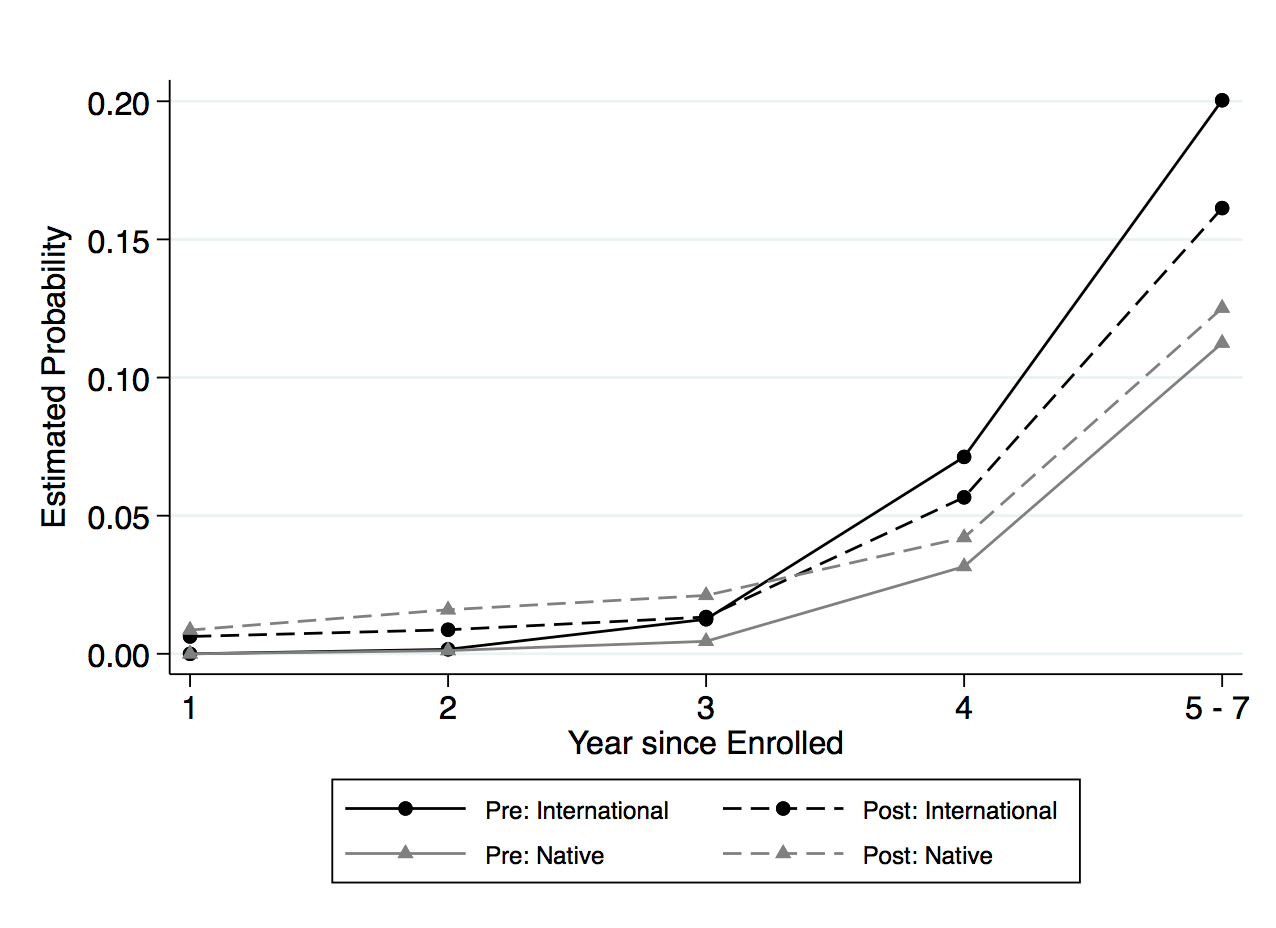
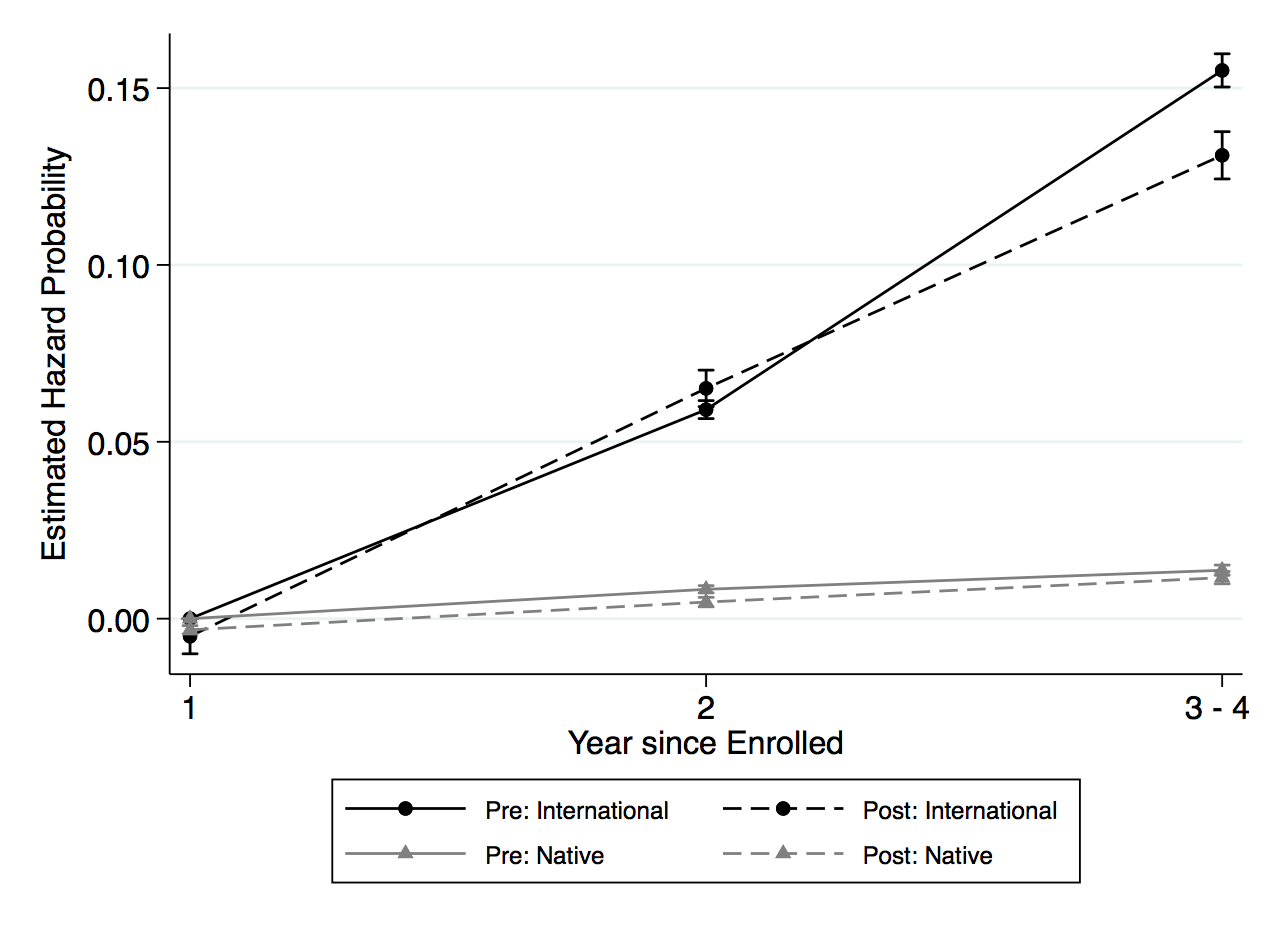
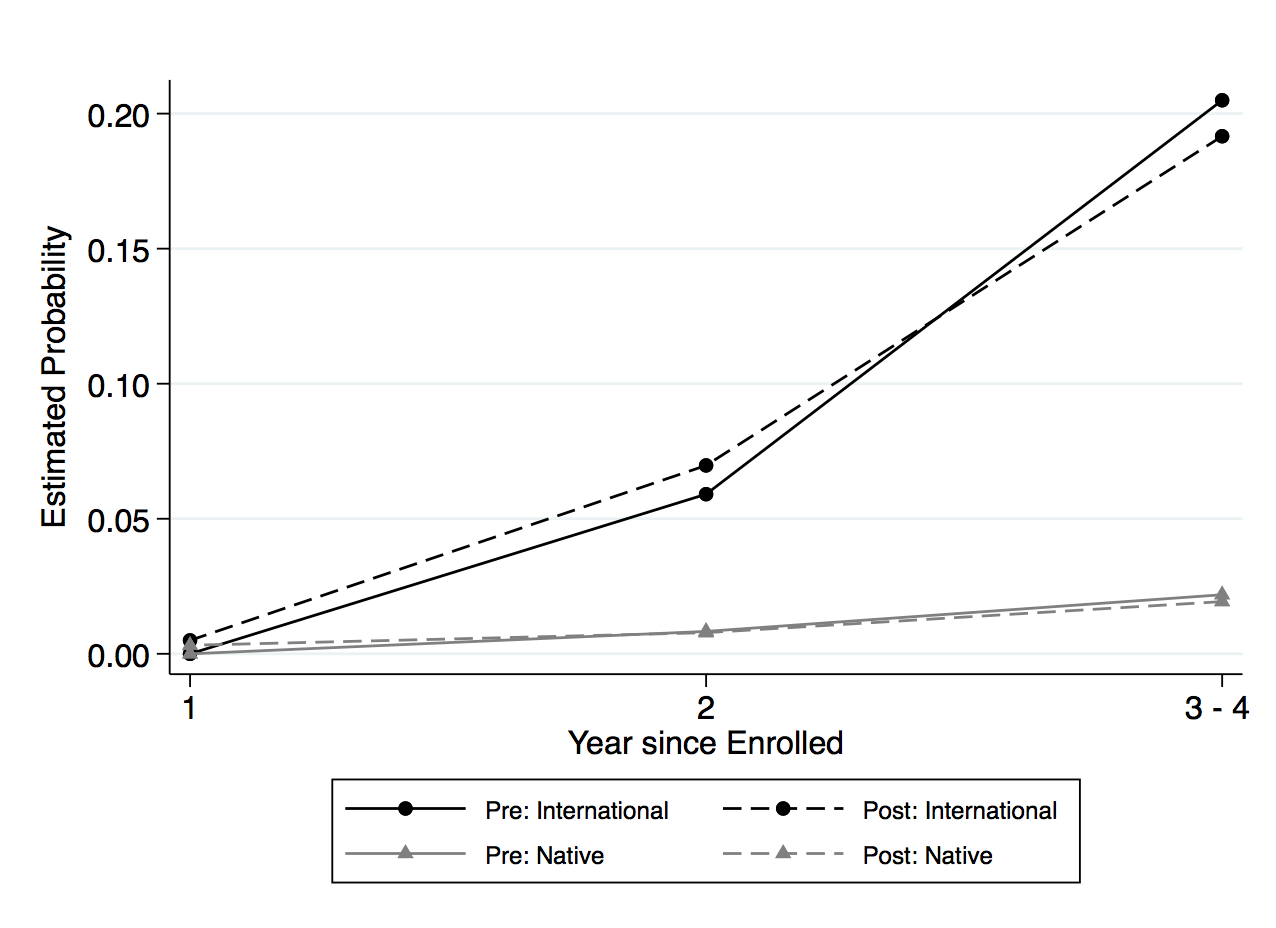
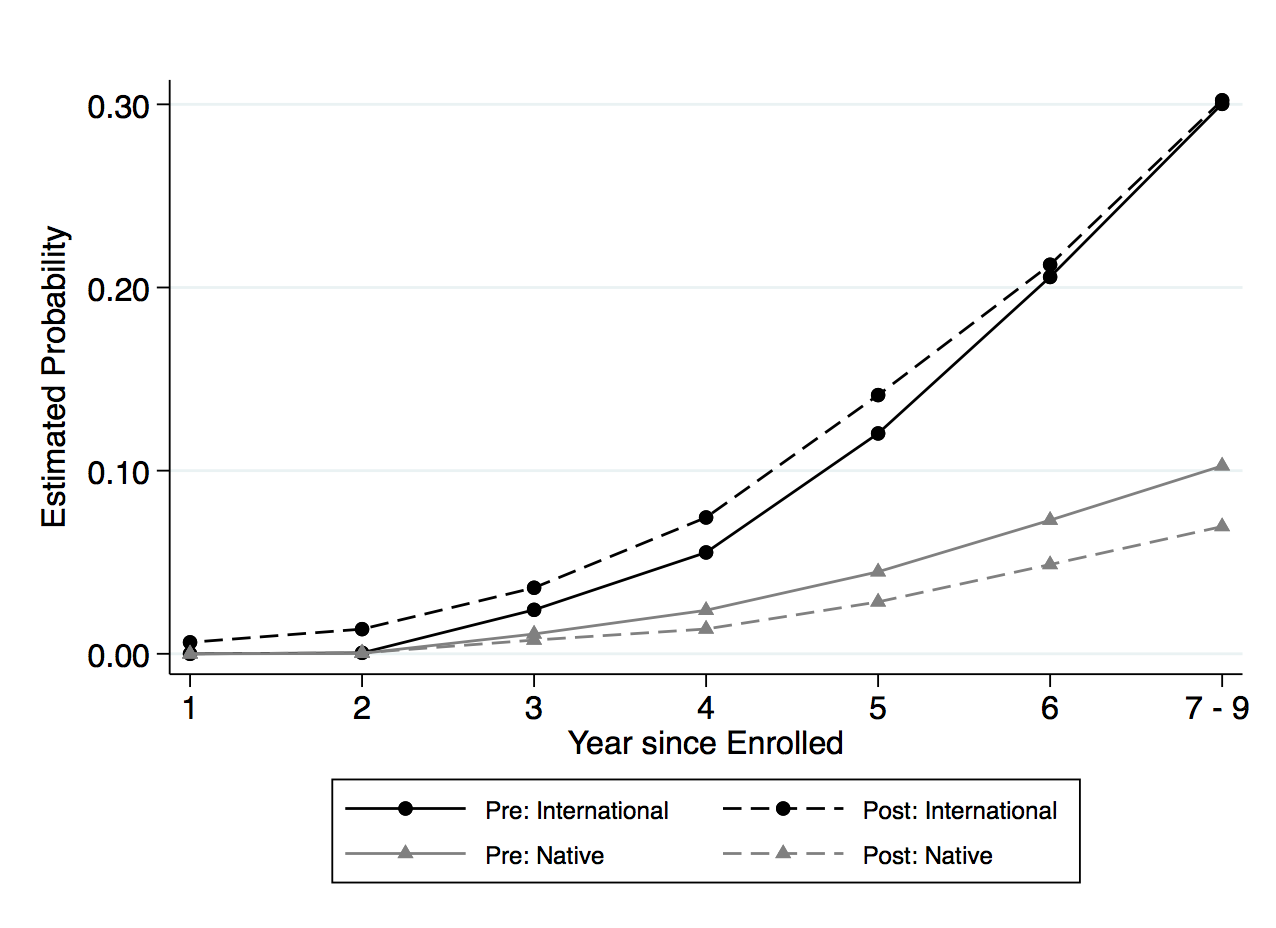
Even though the results are not statistically significant, it is still helpful to illustrate the findings in column 3 to understand the path toward degree completion for both domestic and international students. Figure 3, panel (a) shows the graphical form of the difference-in-differences analysis of the hazard rate for both international and domestic students. As previewed in table 3, the share of traditional STEM degree program is lower after the extension, and the hazard function of both domestic and international students shows a similar relationship. In figure 3, panel (a) the dashed lines plot the hazard rate for each year, postextension; for both international and domestic students, the dashed lines are lower than the preextension lines. While domestic students have a lower risk of completing the traditional STEM degree program compared to international students throughout the schooling spell, the more significant period is in the third year after enrollment. International students have a positive risk of completing the degree in this third year, while domestic students only face a high risk of completing after the fourth year. After the extension, the decrease in the hazard rate is also the smallest in the third year for international students.
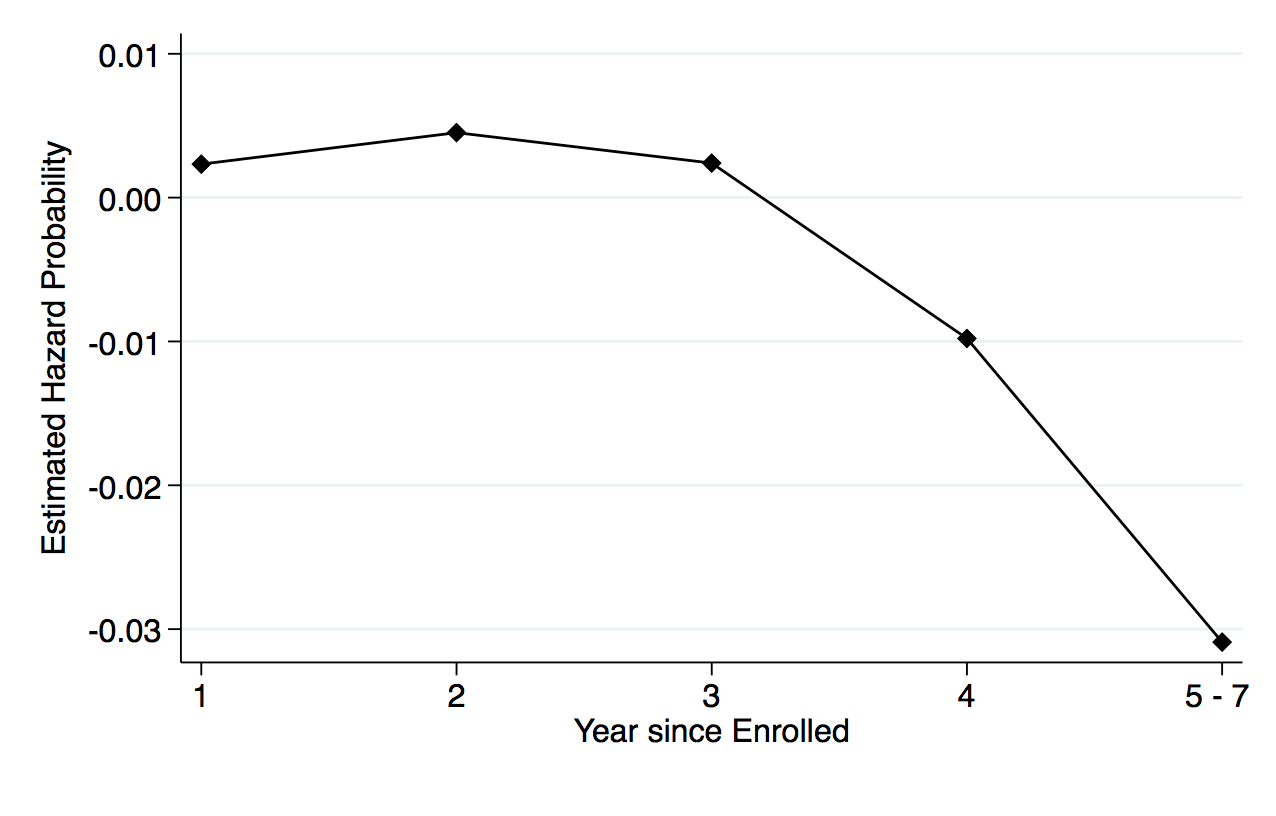
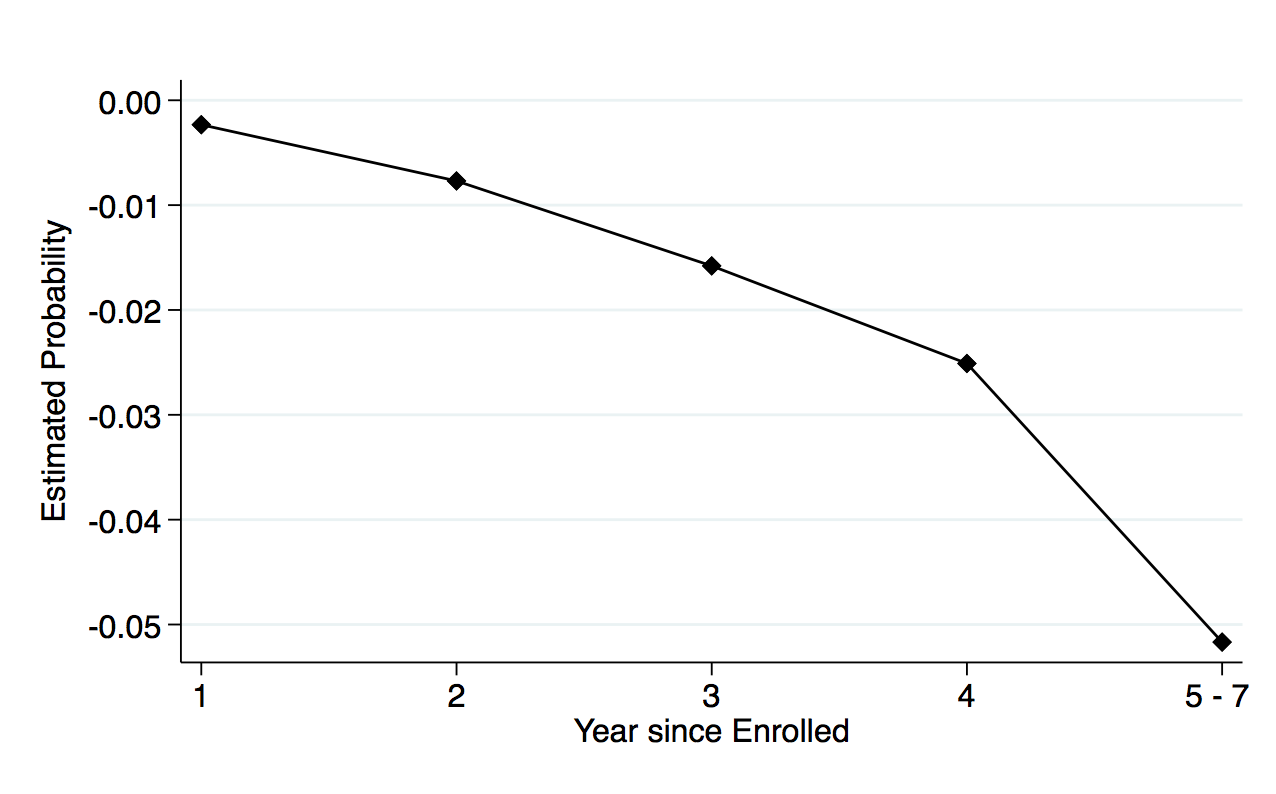
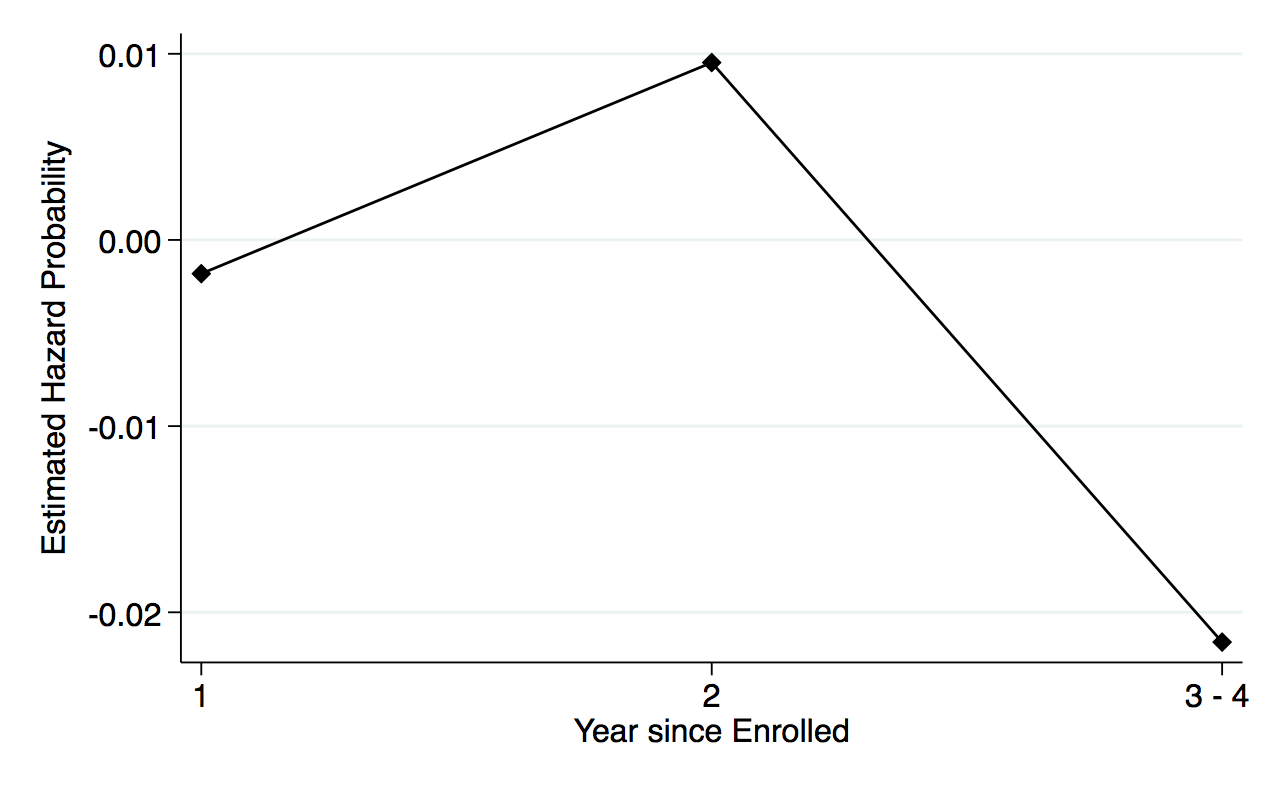
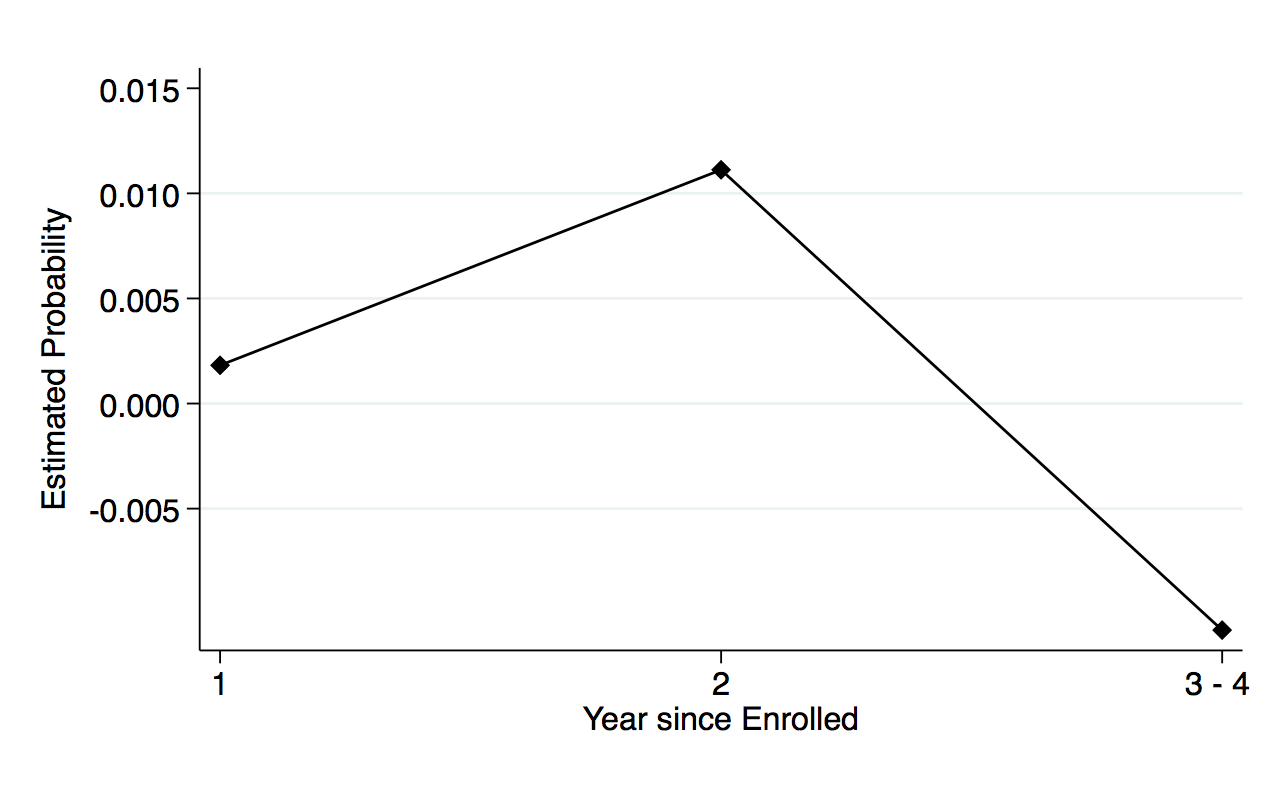
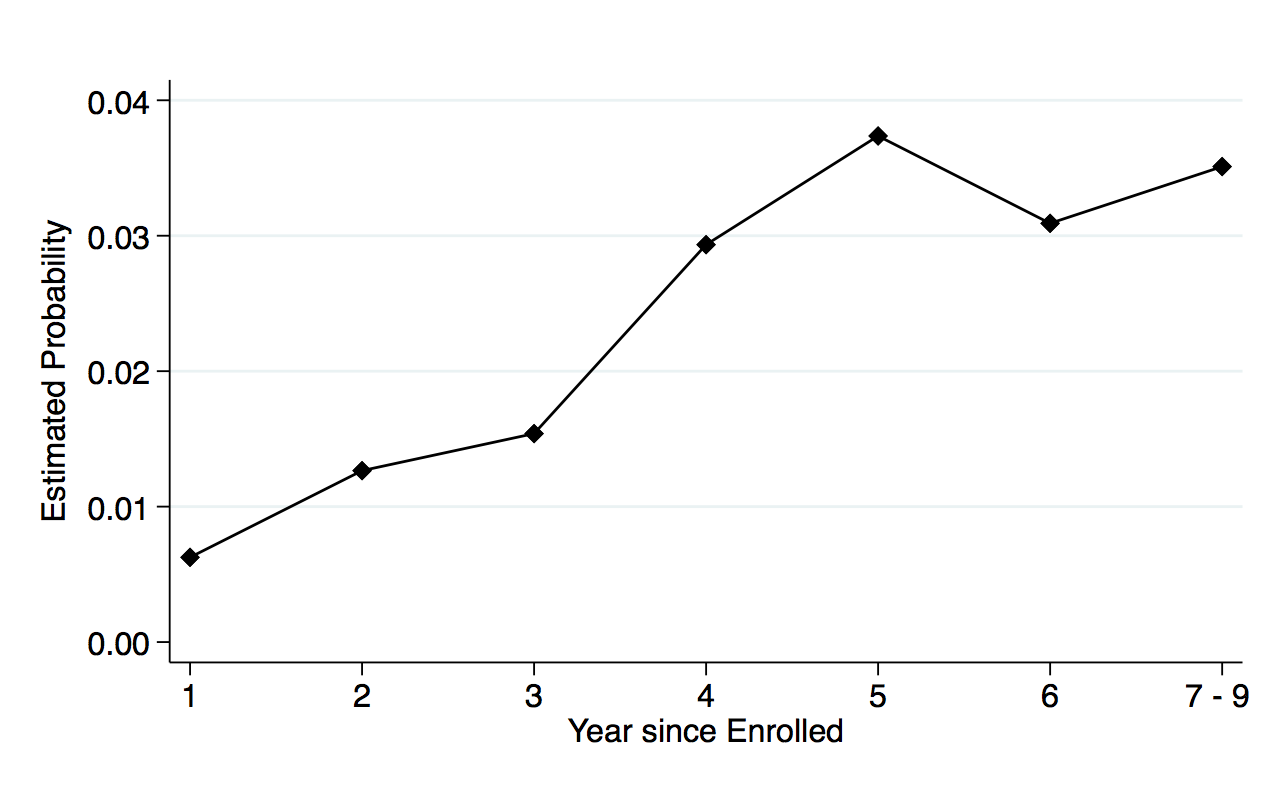
Figure 3, panel (b) shows the corresponding estimates of the OPT extension effect on the hazard rates for completing traditional STEM programs for international students. Note that the figure also plots the coefficient estimates for “Tenure by international by post ’08” from column 3 of table 3. For further clarity, I trace the path toward degree completion by showing the probability of completion before and after the extension for both domestic and international students in figure 3, panel (c). Figure 3, panel (d) shows the difference-in-differences estimates of the probability by each year, and shows that international students have a 0.7 percentage point increase in completing the traditional STEM degree program by the third year after the extension.8While I restricted the sample to students who enroll in the institution as first-year students, I cannot observe if they enter with transfer credits from preuniversity programs. This could potentially explain how students take less than four years to complete their bachelor’s degree. Additionally, students can maximize on the full credit hours per semester to complete their degree in less than four years. This is about a 6 percent increase from the probability in completion rates for international students.
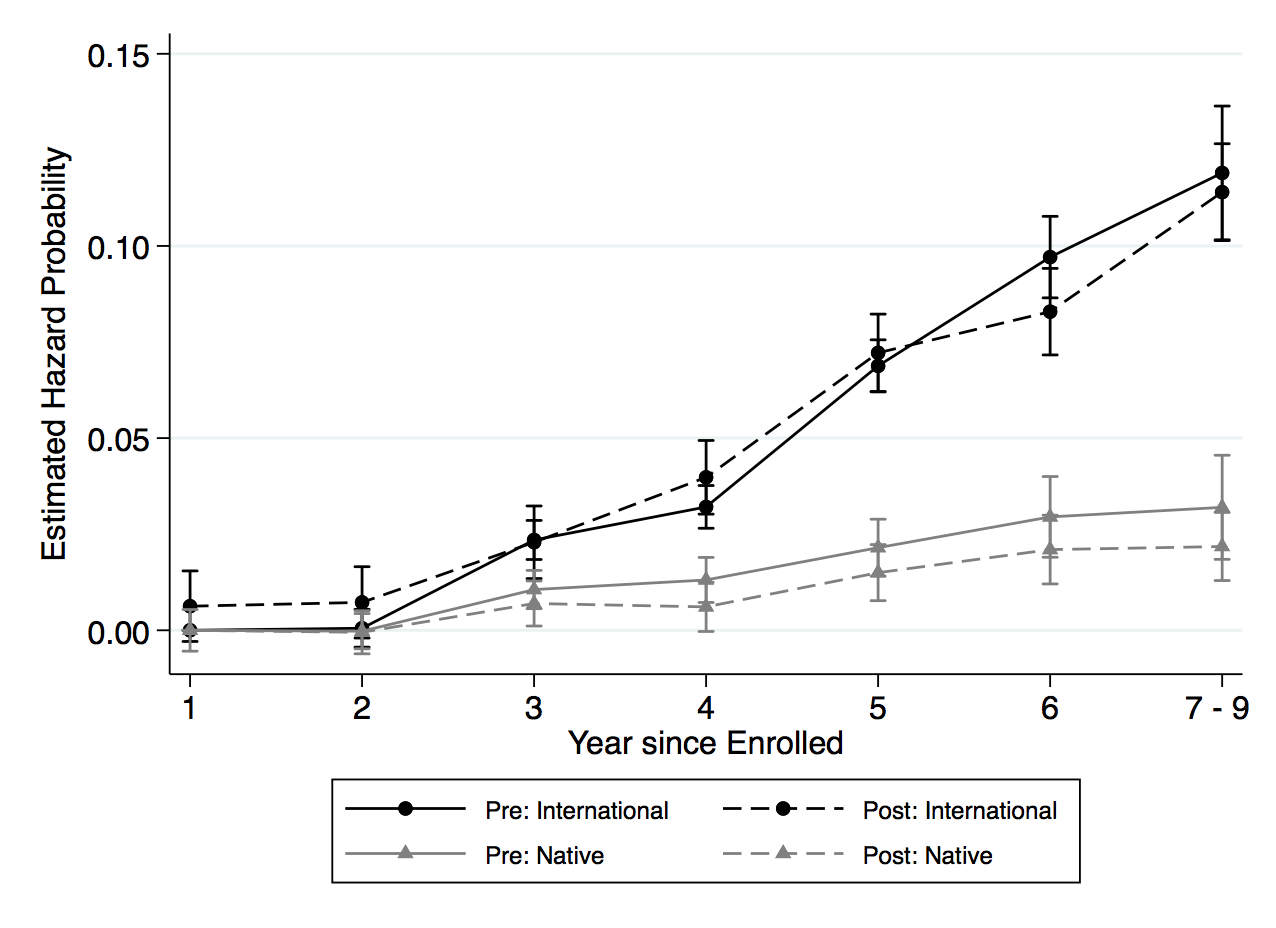
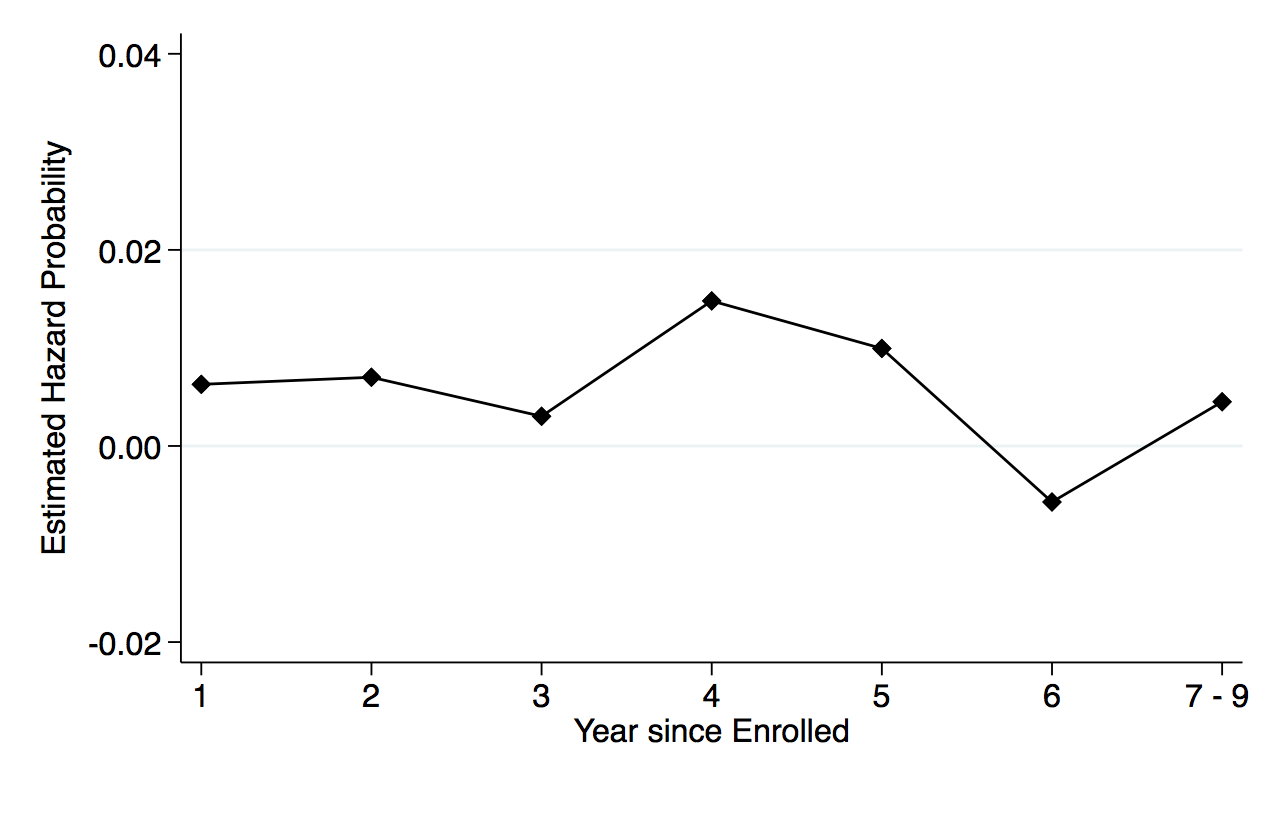
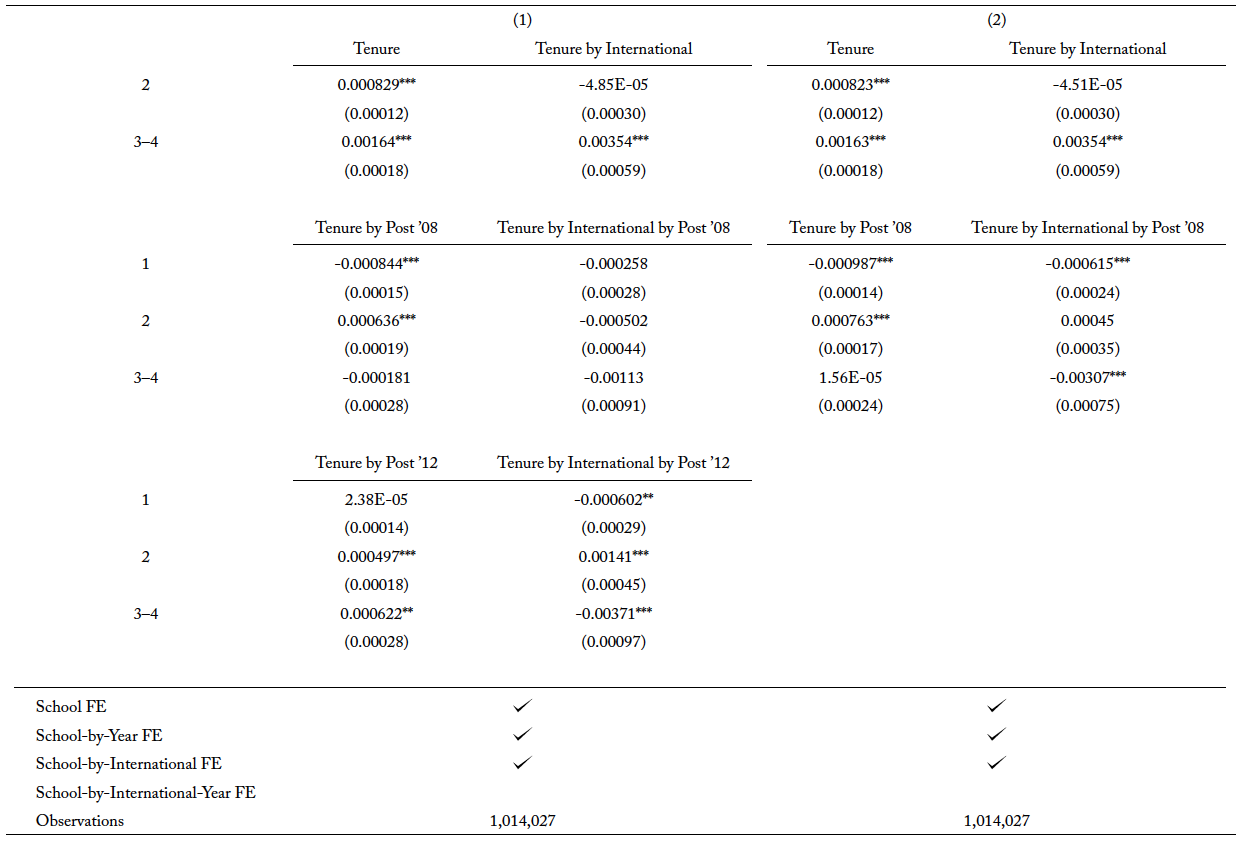
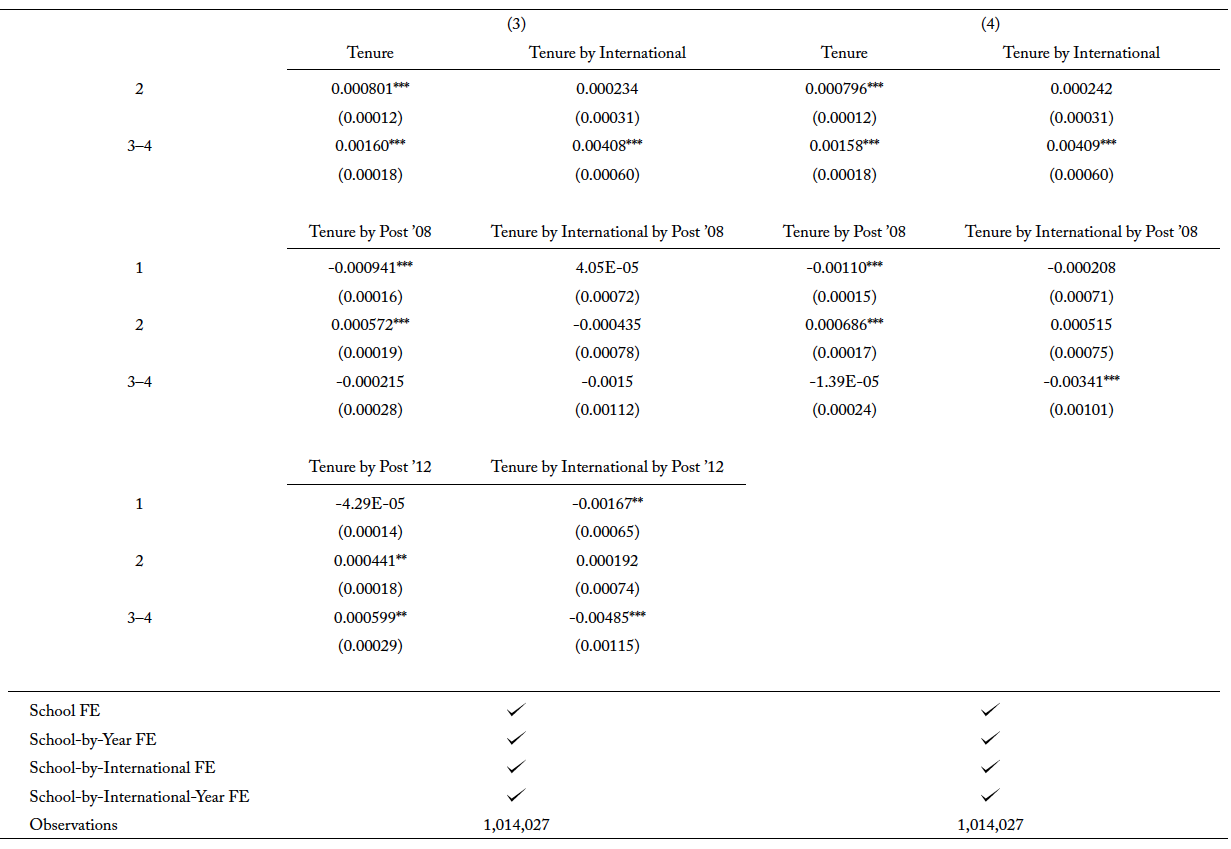
Using the same empirical approach, I examine the OPT extension on the completion of master’s and PhD degrees in traditional STEM fields. The results from both tables A3 and A4 show that the effect of OPT extension is positive for master’s and PhD degrees, respectively, after accounting for the compositional change in the types of international students as well as the potential substitution into newly added STEM fields. Since master’s programs are usually two years long, it is not surprising that international students are at the greatest risk of completing their degree in the second year. It is also the year that records a positive hazard rate. While the effect of the OPT extension is less obvious for bachelor’s degrees, its effect for master’s programs is significant. In figure 4, panel (a), it is apparent that, conditional on not completing in the first year, international students are more likely to complete the degree in the second year after the extension. Panels (c) and (d) show there is a 7 percentage point increase in the probability of completing a traditional STEM degree program for international students after the policy change.
The largest effect the OPT extension has, however, is on the PhD program. Figure 5, panel (c) shows that the probability of international students completing a traditional STEM degree program throughout the schooling spell increases after the extension, where the highest risk of completion is in the fifth year since enrollment. This relationship is seen in panel (d), where the highest peak in probability is in the fifth year at around 0.034. Compared to the completion rate of international students before the extension, the increase in the probability is about 11 percentage points. In figure 5, panel (a), after the extension, the hazard rate for international students decreases after the fifth year. Simple interpreting the hazard rate, this means that, conditional on not graduating by the fifth year, international students now have a low risk of completing the degree.
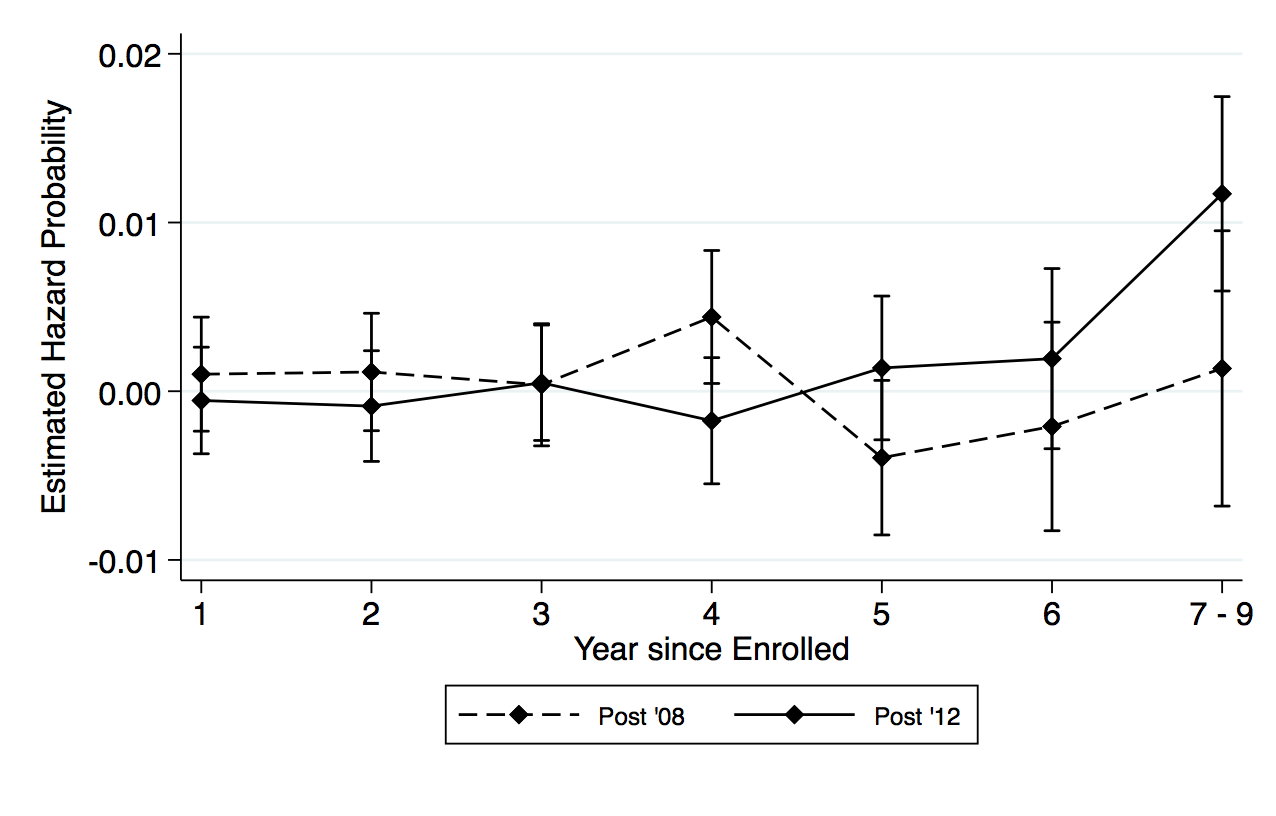
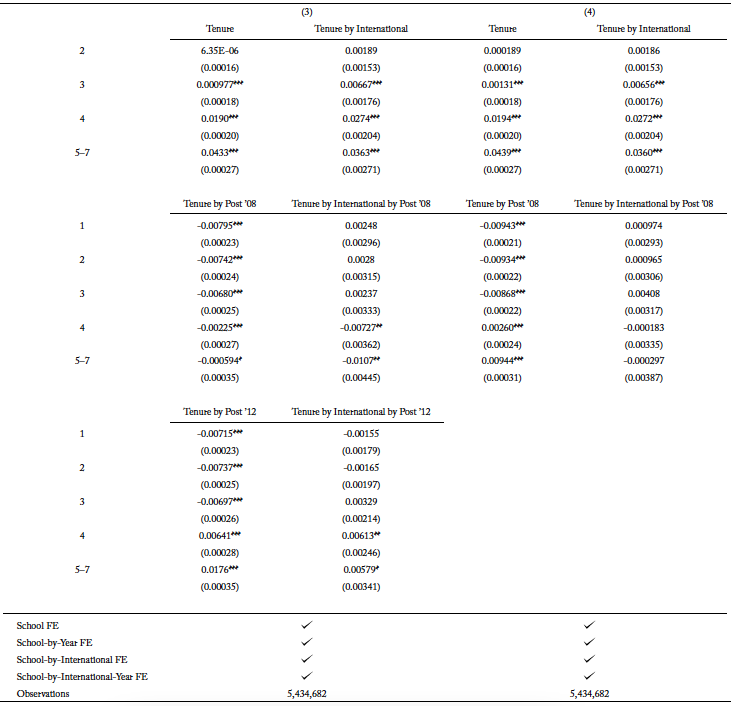
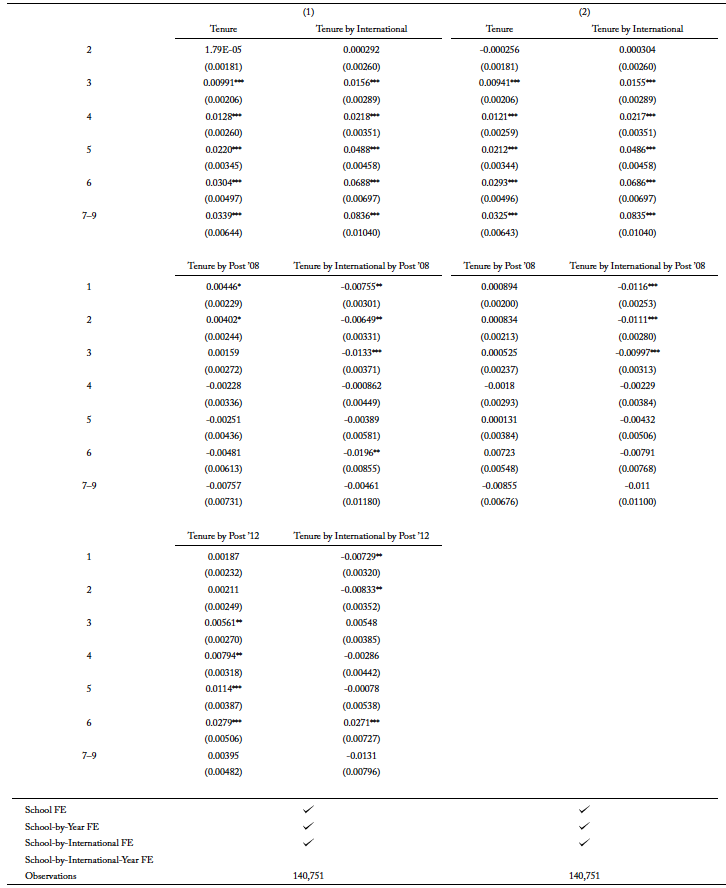
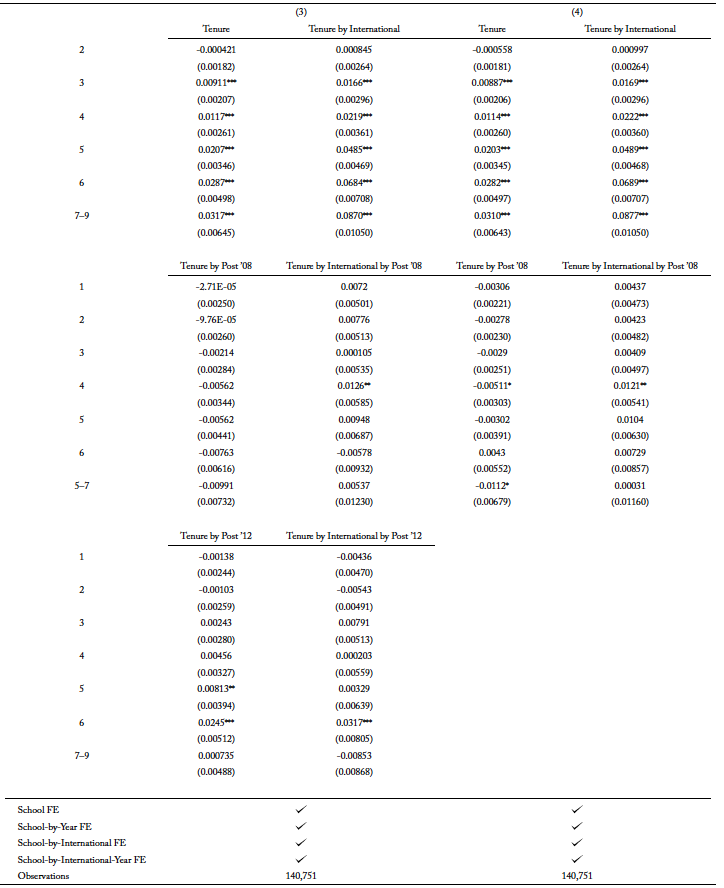
Similar to understanding the enrollment of international students in newly added STEM fields, I use equation 2 to study the completion of newly added STEM programs. The results for the estimation for bachelor’s, master’s, and PhD programs are in tables A5, A6, and A7, respectively. The point estimates for “Tenure by international by post ’08” are either negative or close to zero. Furthermore, the coefficients on “Tenure by international by post ’12” provide more evidence of the response in major choices to the OPT extension. As newly added STEM degree programs qualify for the extension, there is a positive hazard rate in the later years for international students pursuing bachelor’s degree and PhD degrees, and the hazard rate for the second year of master’s degrees is also positive.
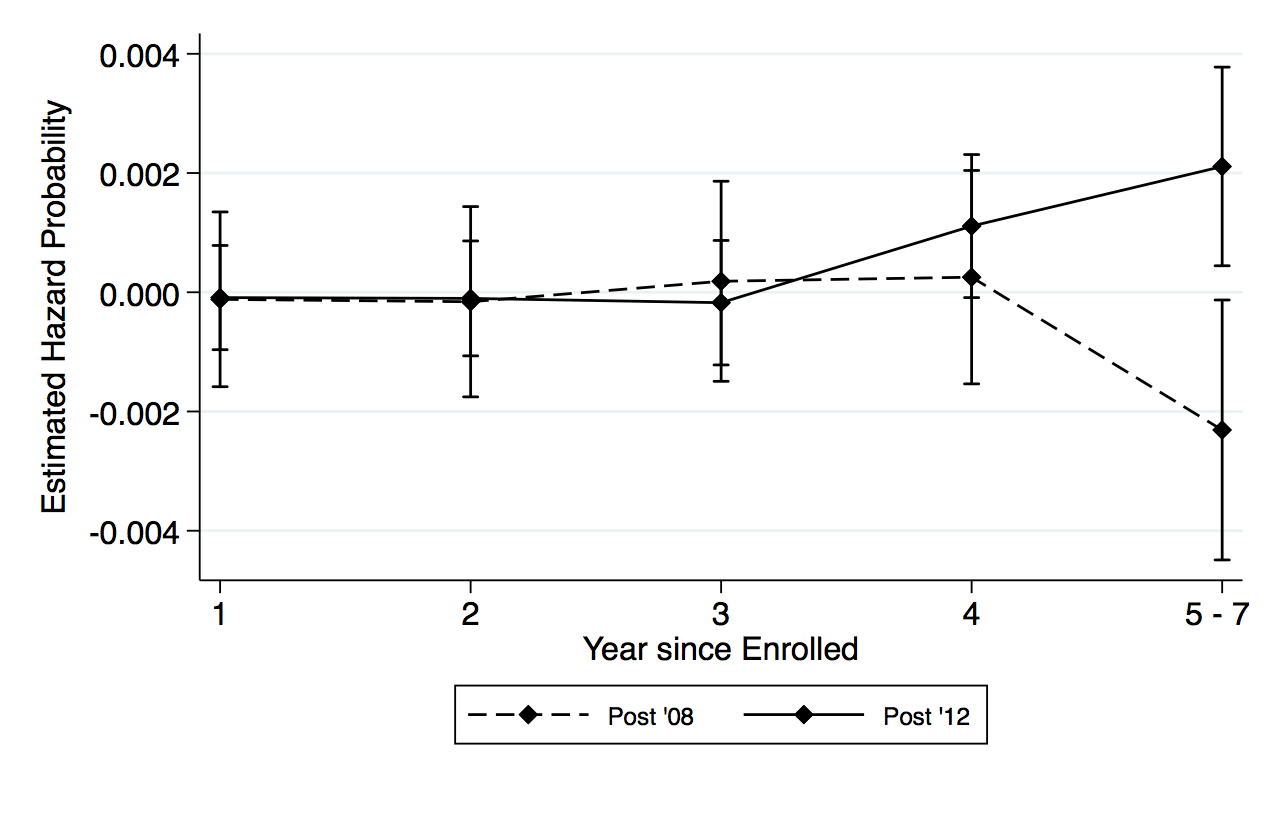
Panel (a) in figure 6 plots the estimated effect of newly added STEM degrees in bachelor’s degrees qualifying for the OPT extension in 2012 on the hazard rate for international students relative to domestic ones. The solid line shows that the risk of completing newly added STEM degrees increases after the third year when the fields qualify for the OPT extension. For ease of comparison, as well as a check, I also plot the hazard rate for the completion of newly added STEM degrees for students who were enrolled in school before and after 2008. The dashed line shows that there is no effect of the 2008 OPT extension on the probability of international students completing newly added STEM degrees. In fact, the hazard rate is close to zero for the first four years and starts declining after.
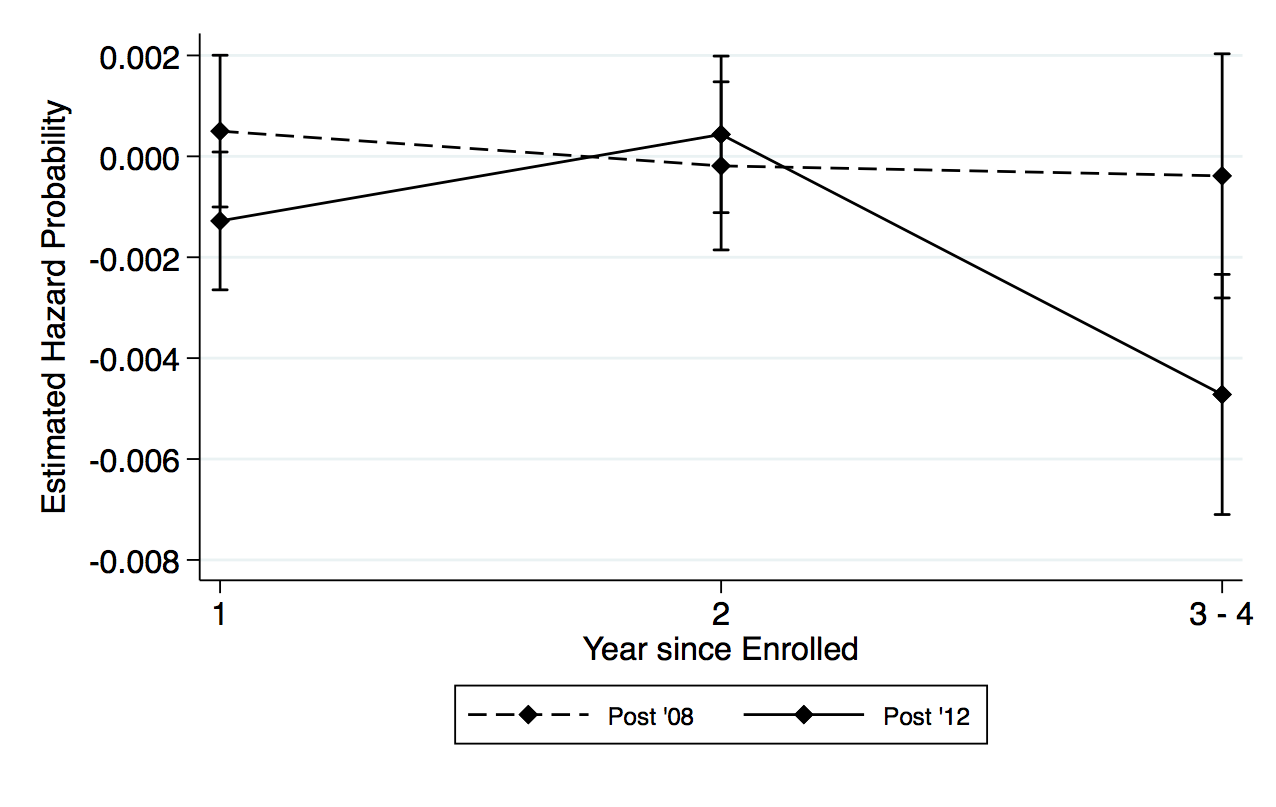
In figure 6, panel (b), I show the result for master’s degrees. While the effect of newly added STEM fields qualifying for the OPT extension is very small in magnitude, the general pattern does show that the hazard rate increases in the second year. Furthermore, the small change induced by the qualification of the OPT extension in the second year for students enrolled after 2012 is slightly more apparent when compared with the declining rate of the hazard function, which models the 2008 change. The hazard function in figure 6, panel (c) shows a steady increase in risk of completing newly added STEM degrees for PhD degree after the fourth year of enrollment, and there is a sharp increase after the sixth year. These results suggest that newly added STEM degrees in PhD programs qualifying for the OPT extension in 2012 have a positive effect on the probability of completion. However, there is an unexpected rise in the hazard rate in the fourth year after the 2008 OPT extension. Since newly added STEM programs did not quality for 2008 change, there should not be any effect of the OPT extension. However, other than the fourth year, it is reassuring the hazard rates are mostly zero or negative.
Effects of OPT Extension on Average Quality of International Students in STEM Programs
Last, I provide more direct evidence of changes in the quality of international students who enroll in academic institutions in the United States for traditional STEM degrees after the policy extension. Given how the hazard rate changes after accounting for potential compositional changes in international students who enroll after the extension, I further examine the differential in quality and types of international students. Using first-term GPA as a proxy for students’ academic quality, I estimate equation 3 and compare the average academic quality of international students who enroll in STEM degree programs before and after the extension.
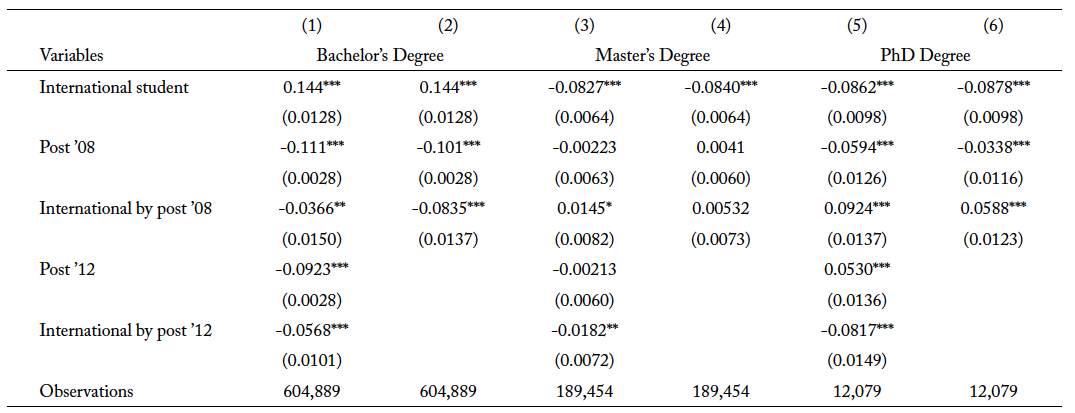
Table 5 shows the effect of the OPT extension on the first-term GPA for international students who enroll in a traditional STEM program after the OPT extension for all the levels of program. The coefficient of interest for “International by post ’08” in column 1 indicates that the OPT extension leads to a statistically significant decline of 3.66 percentage points in first-term GPAs for international students pursuing a bachelor’s degree. This suggests that lower-ability students are induced into majoring in traditional STEM programs after the OPT extension. When I account for the newly added STEM programs qualifying for the extension in 2012, the coefficient of interest increases by 4.69 percentage points. This result is consistent with the evidence from thhe earlier analysis of table 3, where among international students in traditional STEM fields, lower ability students are substituting into newly added STEM majors.
For graduate programs, however, international students who are induced to study a traditional STEM field after the extension are in the right tail of the ability distribution. In columns 4 and 6, the coefficient of interest shows an increase in the first-term GPA after the OPT extension, albeit statistically insignificant for the master’s degree. In addition, when accounting for the newly added fields in 2012, the coefficient of interest in both columns 3 and 5 shows a larger magnitude for the increase in first-term GPA when compared to columns 4 and 6, respectively. Here, both coefficient of interests are statistically significant. These results show that while higher-ability international students are selecting themselves into traditional STEM degree program after the extension, those who are on the left tail of that distribution substitute themselves into the newly added STEM fields when they qualify for the extension in 2012.
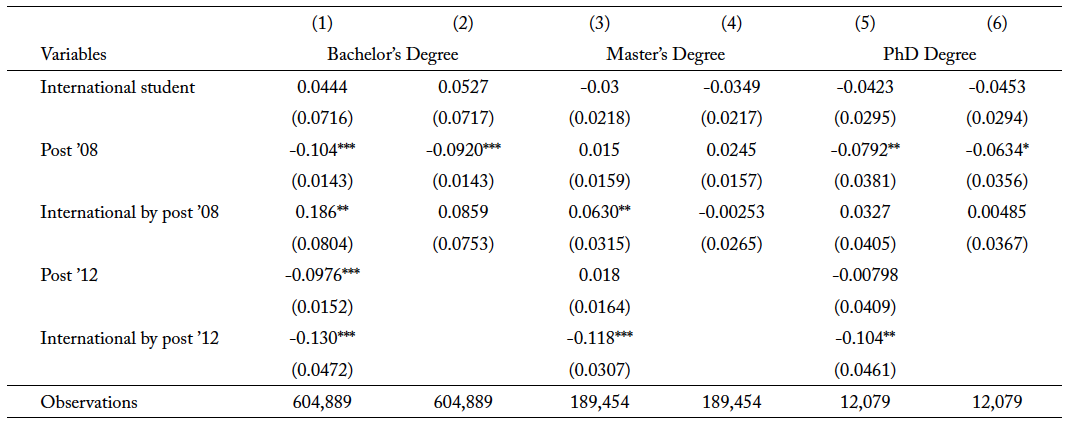
As a robustness test, I estimate equation 3 for the newly added STEM programs. Table 6 shows the estimated results. The coefficient for “International by post ’08” in columns 2, 4, and 6 show a statistically insignificant value, and they are close to zero for master’s and PhD degrees. This is not surprising as these fields were only included as STEM fields in 2012, and students who choose to study those fields in 2008 will not benefit from the policy change. For this reason, the coefficient of interest for these fields is for “International by post ’12.” In column 1, there is a negative coefficient of 0.13 for first-term GPAs for international students in bachelor’s degree programs. This means that lower-ability students are induced to study newly added STEM fields after they qualify for the OPT extension in 2012. I observe a similar relationship for both master’s and PhD degrees, where they show a decrease of 1.18 percentage points and 1.04 percentage points, respectively.
Conclusion
This study provides insight to the effect of OPT extensions on international student enrollment in STEM programs and their completion rates. I show that the OPT program is an effective tool to increase enrollment in STEM fields in higher education, especially at the undergraduate level. I find that international students are 1.8 percentage points (5.4 percent) more likely to enroll in traditional STEM fields after the extension. I find that international students are 6 percent more likely to complete a bachelor’s degree in traditional STEM fields after the OPT extension, while the increase in master’s degrees and PhD degrees are 7 percent and 11 percent, respectively.
The results also consider the potential substitution of international students into newly added fields, which qualify for the extension in later years, as well as the potential compositional changes in the types of international students who enroll into academic institutions after the policy extension. I also explore how average academic quality changes for international students who were induced to choose STEM degrees after the extension, and I find a decline in the average first-term CGPA. Further analysis suggests that international students who are induced into STEM degree programs are international students who would have chosen the fields that eventually qualify for the extension in 2012.
These results also provide evidence that international students choose specific majors in accordance with their comparative advantage. Since the marginal benefit of a STEM degree program increases, international students in fields that have a high complementary in skills would now select into STEM fields. The decrease in the average quality of international students in STEM fields also aligns with the Roy model as marginal students who are induced to choose a STEM degree program are higher-ability international students in fields that eventually qualify for extension who are now the lower-ability students in STEM degree programs.
From a policy perspective, my study provides insight to the effect of OPT extensions. Given the growing concern that the United States is falling behind other countries in both the production of STEM degree programs and the competitiveness in the STEM workforce, having a better understanding on how international students respond to changes in immigration policies can help address STEM shortages in both academia and the labor force (National Academy of Sciences, National Academy of Engineering, and Institute of Medicine, 2007). My results imply that international students do value work experience in the United States and make their schooling decisions on that dimension. Policies that restrict their ability to gain work experience will adversely affect their higher education enrollment in the US. These implications should be taken into consideration as policymakers consider suspending the OPT program.
Appendix: Figures and Tables
Figure 1. Event Study: Enrollment in Traditional STEM Program
(a) Bachelor’s Degree
(b) Master’s Degree
(c) PhD Degree
Note: Controls included in the regressions are individual demographics fixed effects (gender and age of enrollment). All regressions include field fixed effects, field-by-year fixed effects, school fixed effects, and school-by-year fixed effects. Regressions are also clustered at the degree program level.
Figure 2. Event Study: Enrollment in Newly Added STEM Program
(a) Bachelor’s Degree
(b) Master’s Degree
(c) PhD Degree
Note: Controls included in the regressions are individual demographics fixed effects (gender and age of enrollment). All regressions include field fixed effects, field-by-year fixed effects, school fixed effects, and school-by-year fixed effects. Regressions are also clustered at the degree program level.
Figure 3. Hazard Function and Probability of Completing Traditional STEM Degree by Year since Enrolled for Undergraduate Level
Hazard Function (Completing Traditional STEM Degree)
(a) Hazard Function before and after OPT Extension
(b) Difference-in-Difference Hazard Function
Probability of Completing Traditional STEM Degree by Year
(c) Before and after OPT Extension
(d) Difference-in-Difference
Note: Estimated hazard and survivor probabilities are based on the specification of column 3 in table 3. Panel (a) shows the hazard separately for domestic and international students pre- and postextension. Panel (b) shows the difference-in-differences hazard rates that correspond to panel (a). Panel (c) shows the probability of completing the degree separately for domestic and international students pre- and postextension, while panel (d) shows the corresponding difference-in-differences estimates for the probability.
Figure 4. Hazard Function and Probability of Completing Traditional STEM Degree by Year since Enrolled for Graduate Level (Master’s Level)
Hazard Function (Completing Traditional STEM Degree)
(a) Hazard Function before and after OPT Extension
(b) Difference-in-Difference Hazard Function
Probability of Completing Traditional STEM Degree by Year
(c) Before and after OPT Extension
(d) Difference-in-Difference
Note: Estimated hazard and survivor probabilities are based on the specification of column 3 in table A4. Panel (a) shows the hazard separately for domestic and international students pre- and postextension. Panel (b) shows the difference-in-differences hazard rates that correspond to panel (a). Panel (c) shows the probability of completing the degree separately for domestic and international students pre- and postextension, while panel (d) shows the corresponding difference-in-differences estimates for the probability.
Figure 5. Hazard Function and Probability of Completing Traditional STEM Degree by Year since Enrolled for Graduate Level (PhD Level)
Hazard Function (Completing Traditional STEM Degree)
(a) Hazard Function before and after OPT Extension
(b) Difference-in-Difference Hazard Function
Probability of Completing Traditional STEM Degree by Year
(c) Before and after OPT Extension
(d) Difference-in-Difference
Note: Estimated hazard and survivor probabilities are based on the specification of column 3 in table A5. Panel (a) shows the hazard separately for domestic and international students pre- and postextension. Panel (b) shows the difference-in-differences hazard rates that correspond to panel (a). Panel (c) shows the probability of completing the degree separately for domestic and international students pre- and postextension, while panel (d) shows the corresponding difference-in-differences estimates for the probability.
Figure 6. Hazard Function for Completing Newly Added STEM Degree of International Students Relative to Domestic Students by Year since Enrolled by Program Level
(a) Bachelor’s Degree
(b) Master’s Degree
(c) PhD Degree
Note: Estimated hazard rates are based on the specification of column 3 in tables A6, A7, and A8. Each panel shows the corresponding program level. Each line show the estimation for the pre- and postextension, and each point shows the hazard rate difference between international and domestic students.
Table 1. Summary Statistics by Program Level
Table 2. Estimates of the Effect of OPT Extension on Enrollment in Traditional STEM for Different Levels of Programs
Standard errors are in parentheses. *** p<0.01, ** p<0.05, * p<0.1
Controls included in the regressions are individual demographics fixed effects (gender and age of enrollment). All regressions include field fixed effects, field-by-year fixed effects, school fixed effects, and school-by-year fixed effects. Regressions are also clustered at the degree program level.
Table 3. Estimates of the Effect of OPT Extension on Enrollment in Newly Added STEM for Different Levels of Programs
Standard errors are in parentheses. *** p<0.01, ** p<0.05, * p<0.1
Controls included in the regressions are individual demographics fixed effects (gender and age of enrollment). All regressions include field fixed effects, field-by-year fixed effects, school fixed effects, and school-by-year fixed effects. Regressions are also clustered at the degree program level.
Table 4. Estimates of the Effect of OPT Extension on the Completion of Traditional STEM Degree for Undergraduate Level
Standard errors are in parentheses. *** p<0.01, ** p<0.05, * p<0.1
Controls included in the regressions are individual demographics fixed effects (gender and age of enrollment). All regressions include gender-by-international fixed effects, enrollment-age-by-international fixed effects, field fixed effects, field-by-international fixed effects, and field-by-year fixed effects.
Table 5. Estimates of the Effect of OPT Extension on First-Term GPA among Students in Traditional STEM for Different Levels of Programs
Standard errors are in parentheses. *** p<0.01, ** p<0.05, * p<0.1
Controls included in the regressions are individual demographics fixed effects (gender and age of enrollment). All regressions include field fixed effects, field-by-year fixed effects, school fixed effects, and school-by-year fixed effects.
Table 6. Estimates of the Effect of OPT Extension on First-Term GPA among Students in Newly Added STEM for Different Levels of Programs
Standard errors are in parentheses. *** p<0.01, ** p<0.05, * p<0.1
Controls included in the regressions are individual demographics fixed effects (gender and age of enrollment). All regressions include field fixed effects, field-by-year fixed effects, school fixed effects, and school-by-year fixed effects.
Table 7. Estimates of the Effect of OPT Extension on Last-Term GPA among Students Who Completed Traditional STEM for Different Levels of Programs
Standard errors are in parentheses. *** p<0.01, ** p<0.05, * p<0.1
Controls included in the regressions are individual demographics fixed effects (gender and age of enrollment). All regressions include field fixed effects, field-by-year fixed effects, school fixed effects, and school-by-year fixed effects. Regressions are also clustered at the degree program level.
Table 8. Estimates of the Effect of OPT Extension on the Last-Term GPA among Students Who Completed Newly Added STEM for Different Levels of Programs
Standard errors are in parentheses. *** p<0.01, ** p<0.05, * p<0.1
Controls included in the regressions are individual demographics fixed effects (gender and age of enrollment). All regressions include field fixed effects, field-by-year fixed effects, school fixed effects, and school-by-year fixed effects. Regressions are also clustered at the degree program level.
Table A1. Completion of Traditional STEM Degree by Year in School and Degree Levels
Table A2. Completion of Newly Added STEM Degree by Year in School and Degree Levels
Table A3. Estimates of the Effect of OPT Extension on the Completion of Traditional STEM Degree for Graduate Level (Master’s Degree)
Standard errors are in parentheses. *** p<0.01, ** p<0.05, * p<0.1
Controls included in the regressions are individual demographics fixed effects (gender and age of enrollment). All regressions include gender-by-international fixed effects, enrollment-age-by-international fixed effects, field fixed effects, field-by-international fixed effects, and field-by-year fixed effects.
Table A4. Estimates of the Effect of OPT Extension on the Completion of Traditional STEM Degree for Graduate Level (PhD Degree)
Standard errors are in parentheses. *** p<0.01, ** p<0.05, * p<0.1
Controls included in the regressions are individual demographics fixed effects (gender and age of enrollment). All regressions include gender-by-international fixed effects, enrollment-age-by-international fixed effects, field fixed effects, field-by-international fixed effects, and field-by-year fixed effects.
Table A5. Estimates of the Effect of OPT Extension on the Completion of Newly Added STEM Degree for Undergraduate Level
Standard errors are in parentheses. *** p<0.01, ** p<0.05, * p<0.1
Controls included in the regressions are individual demographics fixed effects (gender and age of enrollment). All regressions include gender-by-international fixed effects, enrollment-age-by-international fixed effects, field fixed effects, field-by-international fixed effects, and field-by-year fixed effects.
Table A6. Estimates of the Effect of OPT Extension on the Completion of Newly Added STEM Degree for Graduate Level (Master’s Degree)
Standard errors are in parentheses. *** p<0.01, ** p<0.05, * p<0.1
Controls included in the regressions are individual demographics fixed effects (gender and age of enrollment). All regressions include gender-by-international fixed effects, enrollment-age-by-international fixed effects, field fixed effects, field-by-international fixed effects, and field-by-year fixed effects.
Table A7. Estimates of the Effect of OPT Extension on the Completion of Newly Added STEM Degree for Graduate Level (PhD Degree)
Standard errors are in parentheses. *** p<0.01, ** p<0.05, * p<0.1
Controls included in the regressions are individual demographics fixed effects (gender and age of enrollment). All regressions include gender-by-international fixed effects, enrollment-age-by-international fixed effects, field fixed effects, field-by-international fixed effects, and field-by-year fixed effects.
References
Altonji, J. G. “The Demand for and Return to Education When Education Outcomes Are Uncertain.” Journal of Labor Economics 11, no. 1 (1993): 48–83.
Altonji, J. G., Arcidiacono, P., and Maurel, A. “The Analysis of Field Choice in College and Graduate School: Determinants and Wage Effects.” In Handbook of the Economics of Education, vol. 5, edited by Eric A. Hanushek, Stephen Machin, and Ludger Woessmann, 305–396. Amsterdam: Elsevier, 2016.
Altonji, J. G., Kahn, L. B., and Speer, J. D. “Trends in Earnings Differentials across College Majors and the Changing Task Composition of Jobs. American Economic Review 104, no. 5 (2014): 387–393.
Amuedo-Dorantes, C., Furtado, D., and Xu, H. “OPT Policy Changes and Foreign Born STEM Talent in the US.” Labour Economics 61 (2019).
Amuedo‐Dorantes, C., Shih, K., and Xu, H. “The Implications of Optional Practical Training Reforms on International Student Enrollments and Quality.” Economic Inquiry (2022).
Anelli, M., Shih, K., and Williams, K. Forthcoming. “Foreign Students in College and the Supply of STEM Graduates.” Journal of Labor Economics.
Arcidiacono, P. “Ability Sorting and the Returns to College Major.” Journal of Econometrics 121, no. 1-2 (2004): 343–375.
Arcidiacono, P., Aucejo, E. M., and Hotz, V. J. “University Differences in the Graduation of Minorities in STEM Fields: Evidence from California.” American Economic Review 106, no. 3 (2016): 525–562.
Arcidiacono, P., Aucejo, E. M., and Spenner, K. “What Happens after Enrollment? An Analysis of the Time Path of Racial Differences in GPA and Major Choice.” IZA Journal of Labor Economics 1, no. 1 (2012): 1–24.
Arcidiacono, P., Hotz, V. J., and Kang, S. “Modeling College Major Choices Using Elicited Measures of Expectations and Counterfactuals.” Journal of Econometrics 166, no. 1 (2012): 3–16.
Beffy, M., Fougere, D., and Maurel, A. “Choosing the Field of Study in Postsecondary Education: Do Expected Earnings Matter?” Review of Economics and Statistics 94, no. 1 (2012): 334–347.
Betts, J. R., and Lofstrom, M. “The Educational Attainment of Immigrants: Trends and Implications.” In Issues in the Economics of Immigration, edited by George Borjas, 51–116. Chicago: University of Chicago Press, 2000.
Black, D. A., Sanders, S., and Taylor, L. “The Economic Reward for Studying Economics.” Economic Inquiry 41, no. 3 (2003): 365–377.
Bleemer, Z. “Affirmative Action, Mismatch, and Economic Mobility after California’s Proposition 209.” The Quarterly Journal of Economics 137, no. 1 (2022): 115–160.
Bostwick, V. K., and Weinberg, B. A. 2018. “Nevertheless She Persisted? Gender Peer Effects in Doctoral STEM Programs.” NBER Working Paper No. w25028. National Bureau of Economic Research, Cambridge, MA.
Bound, J., Braga, B., Golden, J. M., and Turner, S. “Pathways to Adjustment: The Case of Information Technology Workers.” American Economic Review 103, no. 3 (2013): 203–207.
Cortes, K. E. “Do Bans on Affirmative Action Hurt Minority Students? Evidence from the Texas Top 10 Percent Plan.” Economics of Education Review 29, no. 6 (2010): 1110–1124.
Demirci, M. “Transition of International Science, Technology, Engineering, and Mathematics Students to the US Labor Market: The Role of Visa Policy.” Economic Inquiry 57, no. 3 (2019): 1367–1391.
Duffin, E. 2023. “US States with the Most International Students 2022.” Statista. November 2022. https://www.statista.com/statistics/237703/us-states-hosting-the-most-international-students/.
Ehrenberg, R. G. “Analyzing the Factors That Influence Persistence Rates in STEM Field, Majors: Introduction to the Symposium.” Economics of Education Review 29, no. 6 (2010): 888–891.
Griffith, A. L. “Persistence of Women and Minorities in STEM Field Majors: Is It the School That Matters?” Economics of Education Review 29, no. 6 (2010): 911–922.
Hoffmann, F., and Oreopoulos, P. “A Professor Like Me: The Influence of Instructor Gender on College Achievement.” Journal of Human Resources 44, no. 2 (2019): 479–494.
Homeland Security Department. 2021. “Update to the Department of Homeland Security STEM Designated Degree Program List. Federal Register. https://www.federalregister.gov/documents/2022/01/21/2022-01188/update-to-the-department-of-homeland-security-stem-designated-degree-program-list.
Kato, T., and Sparber, C. “Quotas and Quality: The Effect of H-1B Visa Restrictions on the Pool of Prospective Undergraduate Students from Abroad.” Review of Economics and Statistics 95, no. 1 (2013): 109–126.
Kokkelenberg, E.C. and Sinha, E., 2010. Who succeeds in STEM studies? An analysis of Binghamton University undergraduate students. Economics of Education Review, 29(6), pp.935-946.
National Academy of Sciences, National Academy of Engineering, and Institute of Medicine. Rising Above the Gathering Storm: Energizing and Employing America for a Brighter Economic Future. Washington, DC: The National Academies Press, 2007. https://doi.org/10.17226/11463.
Orrenius, P. M., and Zavodny, M. “Does Immigration Affect Whether US Natives Major in Science and Engineering?” Journal of Labor Economics 33, no. S1 (2015): S79–S108.
Ost, B. “The Role of Peers and Grades in Determining Major Persistence in the Sciences.” Economics of Education Review 29, no. 6 (2010): 923–934.
Price, Joshua. “The Effect of Instructor Race and Gender on Student Persistence in STEM Fields.” Economics of Education Review 29, no. 6 (2010): 901–910.
Ransom, M., and Phipps, A. 2010. “Career and Occupational Implications of Undergraduate Majors: Evidence from the National Survey of College Graduates.” Working Paper. Brigham Young University.
Rask, K. “Attrition in STEM Fields at a Liberal Arts College: The Importance of Grades and Pre-Collegiate Preferences.” Economics of Education Review 29, no. 6 (2010): 892–900.
Rosenzweig, M. R. “Higher Education and International Migration in Asia: Brain Circulation.” In Annual World Bank Conference on Development Economics, edited by Pleskovic Boris and Justin Yifu Lin, 59–100). Washington, DC: World Bank, 2008.
Roy, A. D. “Some Thoughts on the Distribution of Earnings.” Oxford Economic Papers 3, no. 2 (1951): 135–146.
Sander, R. H. “A Systemic Analysis of Affirmative Action in American Law Schools.” Stanford Law Review 57 (2004): 367.
She, Q., and Wotherspoon, T. “International Student Mobility and Highly Skilled Migration: A Comparative Study of Canada, the United States, and the United Kingdom.” Springer Plus 2, no. 1 (2013): 132.
Shih, K. “Labor Market Openness, H‐1B Visa Policy, and the Scale of International Student Enrollment in the United States.” Economic Inquiry 54, no. 1 (2016): 121–138.
Shih, K. “Do International Students Crowd-Out or Cross-Subsidize Americans in Higher Education?” Journal of Public Economics 156 (2017): 170–184.
Singer, J. D., and Willett, J. B. “It’s About Time: Using Discrete-Time Survival Analysis to Study Duration and the Timing of Events.” Journal of Educational Statistics 18, no. 2 (1993): 155–195.
Singer, J. D., and Willett, J. B. Applied Longitudinal Data Analysis: Modeling Change and Event Occurrence. Oxford: Oxford University Press, 2003.
Sovero, V., Buchinsky, M., and Baird, M. D. “Playing Catch Up: A Term-Level Investigation of the Racial Gap in STEM Retention.” Economics of Education Review 83 (2021): 102146.
US Senate Committee on Health, Education, Labor, and Pensions. “Strengthening American Competitiveness for the 21st Century.” Full Committee Hearing. March 7th, 2007. https://www.help.senate.gov/hearings/strengthening-american-competitiveness-for-the-21st-century.
Suter, B., and Jandl, M. Comparative Study on Policies towards Foreign Graduates: Study on Admission and Retention Policies towards Foreign Students in Industrialised Countries. Vienna: International Centre for Migration Policy Development, 2006.
US Citizenship and Immigration Services. 2022. Optional Practical Training (OPT) for F-1 Students. https://www.uscis.gov/working-in-the-united-states/students-and-exchange-visitors/optional-practical-training-opt-for-f-1-students
Wang, X. “Why Students Choose STEM Majors: Motivation, High School Learning, and Postsecondary Context of Support.” American Educational Research Journal 50, no. 5 (2013): 1081–1121.
Washington Alliance of Technology Workers v. US Department of Homeland Security, 156 F. Supp. 3d 123 (DDC 2015).
Wiswall, M., and Zafar, B. “How Do College Students Respond to Public Information About Earnings?” Journal of Human Capital 9, no. 2 (2015): 117–169.


