Introduction
Occupational licensure has grown dramatically over time as employment in the United States has shifted from manufacturing to service industries (Kleiner and Krueger 2013). The health care sector is the most licensed profession, with over 75 percent of workers having an active license or certification.1See https://www.bls.gov/opub/mlr/2019/article/professional-certifications-and-occupational-licenses.htm for more details. Profession-specific scope of practice (SOP) laws are an important segment of occupational regulations that articulate requirements and govern practice authorities for health care providers. SOP laws are especially important for nurse practitioners, dental hygienists, and certified nurse midwives because these professionals are generally required to work under the supervision of a more highly trained health professional (e.g., a physician or dentist). Changes in the autonomy level of these professionals significantly affect the boundary of services and settings in which the professional can render services.
In the case of dental hygienists, some research suggests that SOP restrictions in many US states may prevent dental hygienists from delivering certain services, limiting the potential to expand access to oral health care (Manski, Hoffmann, and Rowthorn 2015; Reinders et al. 2017). Since 1988, new legislation has been gradually implemented in many states that enables dental hygienists to perform more tasks without the supervision of a dentist. Nonetheless, as of 2020, Colorado is the only state to place no restrictions on independent dental hygiene practices.2See https://www.adha.org/resources-docs/7513_Direct_Access_to_Care_from_DH.pdf for more details. Advocates of legislative initiatives to reduce SOP regulations believe that doing so will enhance access to dental health care and improve the efficient delivery of services in underserved areas. Furthermore, expanding the scope of practice for dental hygienists is one way to help dental providers meet the rising demand for dental services due to, for example, provisions of the Affordable Care Act (Meyerhoefer, Panovska, and Manski 2016).
Previous research on state-specific SOP laws for dental hygienists has primarily focused on labor and product market effects. For example, Wanchek (2010) and Kleiner and Park (2010) find that stringent practice regulations on dental hygienists result in lower wages and slower employment growth for hygienists; Wing and Marier (2014) find that expanding the SOP reduces the prices of basic dental services. There are no studies that we are currently aware of that determine the impact of SOP laws for dental hygienists on both dental care use and costs, and we seek to fill this gap in the literature.
SOP laws for dental hygienists could influence the utilization of dental care through a variety of channels. Greater autonomy for hygienists may increase dental care utilization if more hygienists are able to practice where there are fewer dentists, thereby reducing pecuniary and non-pecuniary travel costs and appointment wait times for consumers. Also, expanding hygienists’ SOP can enable them to administer basic teeth cleanings and examinations without supervision, which could liberate dentists to perform more complex procedures. On the other hand, if consumers view hygienists’ clinical competence as lower than that of dentists, they may reduce their consumption of dental care in the regions that allow hygienists to perform more tasks. Therefore, the overall effect of hygienist regulations on dental care utilization must be determined empirically.
We exploit variation within states over time in SOP laws in order to determine their effect on dental care use and expenditure. We collected detailed information on dental hygienist SOP regulations from individual state statutes from 2001 to 2014 and merged these with data on dental care utilization from the Medical Expenditure Panel Survey (MEPS). Focusing on areas with a shortage of dental providers, we find evidence that more autonomy for dental hygienists increases the use of preventive dental care and reduces the need for the number of dental treatment visits. Expanding dental hygienist autonomy is also associated with increases in the use of many services that dental hygienists are allowed to perform, such as examinations, cleanings, fluoride applications, sealant applications, and fillings. Our analysis of qualitative measures of access to care suggests the increased use of these services is in part due to the reduction of barriers to care in shortage areas. Furthermore, both patient payments and payments from insurers are lower at higher autonomy levels for those that are regular users of dental care, suggesting that expanding the scope of practice of dental hygienists could concurrently increase access to care and reduce long-run costs. We believe the associated cost savings reflect the cost-effectiveness of preventive care in reducing the need for subsequent dental treatment.
Background
The first training program for dental hygienists was established in 1914, and as of 2016 there were a total of 336 baccalaureate and masters-level programs to train dental hygienists (Picard 2009; Mertz 2016). Dental hygienist licensure is required by all states, which have different requirements and different scope of practice regulations. Typically, dental hygienists are allowed to perform basic dental services with or without a dentist’s oversight. Such services are usually considered preventive dental care and primarily include cleaning teeth, screening patients for oral health status, applying sealants or fluorides, and taking dental X-rays. In some states with expanded scope of practice, hygienists are allowed to place amalgam restorations and administer local anesthesia.3 See https://www.bls.gov/ooh/healthcare/dental-hygienists.htm for more details on dental hygienists’ duties.
Literature Review
Like other health fields, in the dental field there is intra-professional friction between dentists and dental hygienists over SOP rules. Complicating the push for expanded SOP by hygienists is the fact that dental hygienists are regulated by state dental boards made up primarily of dentists (Koppelman, Vitzthum, and Simon 2016).
An important issue for policymakers is whether the expansion of provider SOP would improve the efficiency of health care delivery. The economic theory of licensure regulations predicts that more stringent regulations may reduce wages and employment of the regulated professional (Kleiner 2016). Empirically, these predictions are borne out in research on the SOP of nurse practitioners (Kleiner 2016; McMichael 2018; Perry 2009), physician assistants (Perry 2009; Timmons 2017; McMichael 2018), nurse anesthetists (Negrusa et al. 2016), and chiropractors (Timmons, Hockenberry, and Durrance 2016). In the case of dental hygienists, Wanchek (2010) and Kleiner and Park (2010) also find that stringent practice regulations for hygienists result in lower wages and slower employment growth, but they do not examine dental care delivery.
In theory, occupational regulations for health care providers are expected to raise the price and reduce the demand for health care services. Among the very few studies that examine how scope of practice regulations affect the health care system, Kleiner et al. (2016) find that stronger regulation of nurse practitioners raises the price of well-child visits. Markowitz et al. (2017) find that states with no barriers for certified midwives have a higher probability of midwife-attended births but have very few effects on infant health outcomes. Using the Medical Expenditure Panel Survey (MEPS), Traczynski and Udalova (2018) find that nurse practitioner independence increases the number of routine checkups, medical care for underserved populations, and other measures of health care quality. All of the three aforementioned studies use a difference-in-differences framework with staggered implementation of scope of practice laws.
Four studies on SOP laws are specific to dental care. Kleiner and Kudrle (2000) collected dental legislative information for the period from 1960 to 1994 and compared the oral health outcomes of Air Force personnel over time to show that stricter SOP regulations raise the price of dental services and earnings of dentists but do not lead to better oral health. Wing and Marier (2014) used the 2005–2007 FAIR claims data to estimate the prices of seven basic services that hygienists are allowed to perform. They found that regulations that limit the authority of dental hygienists to provide services increase the prices of those services by approximately 12 percent but do not affect dental care utilization.
Wing et al. (2005) developed an index to assess practice environment of dental hygiene across US states in 2001. After merging this index to the 2002 Behavioral Risk Factor Surveillance System (BRFSS) survey, they find that states with expanded scope of practice for dental hygienists (i.e., higher practice environment scores) have greater dental care use. Langelier et al. (2016) updated the index developed by Wing et al. (2005) to 2014 and merged the 2001 and 2014 indices to the 2001 and 2012 BRFSS, respectively, to show that greater autonomy for dental hygienists is associated with a lower probability of having had any teeth removed because of decay or disease. However, one limitation of both studies is that they only estimate cross-sectional associations.
All previous studies of dental hygienist SOP, with the exception of Kleiner and Kudrle (2000), use the BRFSS. The outcome variable in the BRFSS that measures dental care utilization is constructed from a survey question that asks whether the respondent has ever had a teeth cleaning by a dentist or dental hygienist in the previous year, which only allows analysis at the extensive margin of preventive dental care. In contrast, we use the Medical Expenditure Panel Survey (MEPS), which contains a large set of dental care utilization measures. In particular, we are able to construct measures of preventive care visits, visits for dental treatment, hygienist visits, and dentist visits. Furthermore, we exploit the panel dimension of the MEPS to mitigate omitted variable bias associated with unmeasured characteristics of states and patient populations that are correlated with practice environments. Finally, we focus on areas with a shortage of dental care professionals, where changes in SOP laws are most likely to affect access to care.
Dental Hygiene Professional Practice
Like several previous studies, our study makes use of the Dental Hygiene Professional Practice Index (DHPPI). In order to quantify the SOP of dental hygienists for all states, the Center for Health Workforce Studies first created the DHPPI for the year 2001 and updated the index for the year 2014 using the same set of items (Oral Health Workforce Research Center 2016). The DHPPI index is composed of 37 items, with each categorized into four broad components: (1) legal and regulatory environment,4The variables in Legal and regulatory environment capture governance of the profession through the state regulatory board of dental hygiene or a dental hygiene committee empowered by a dental board with a mandate to regulate the profession, licensure by credential or endorsement with no new clinical exam required, scope of practice defined in law or regulations, and restriction to the patient of record of the primary employing dentist. (2) supervision levels in different practice settings, (3) tasks permitted under varying levels of supervision,5Tasks evaluated in this section include prophylaxis, sealants, fluorides, X-rays, hygiene screening and assessment, as well as expanded functions such as placing amalgam restorations, administration of local anesthesia, and administration of nitrous oxide. and (4) reimbursement.6The two variables in Reimbursement indicate whether direct reimbursement to hygienists is available from Medicaid and whether direct payment is allowed from other third-party insurers or patients. Each item of the DHPPI is assigned a weighted score to reflect its relative impact on the ability of the dental hygienists to provide services. The DHPPI score for each state is thus the total score of the 37 items, ranging from 0 to 100, with higher scores reflecting a more autonomous practice environment for dental hygienists.
We extended the DHPPI by collecting information on the effective year of legislative changes associated with each item of the DHPPI in order to compute the index for the intervening years from 2002 to 2013. We rely on several sources to identify and verify the timing of law changes for each state. They include advocacy files at the American Dental Hygienists’ Association (ADHA) website,7For more details on the policy changes in dental hygienist SOP laws, see: https://www.adha.org/sites/default/files/7513_Direct_Access_to_ Care_from_DH.pdf, https://www.adha.org/sites/default/files/7514_Local_Anesthesia_Requirements_by_State.pdf, and https://www.adha.org/ sites/default/files/75111_Self_Regulation_by_State.pdf. and reviews of state statutes and administrative regulations.
Rather than using the index itself, we use the changes in the second component of the DHPPI, the supervision levels component, to identify the effect of dental hygienist SOP laws in our analysis. The Supervision component of the DHPPI characterizes the level of autonomy dental hygienists are given to perform various tasks. Based on the way that supervision levels are defined in the DHPPI, we categorized dental hygienist autonomy into four levels, including direct supervision (level one), general supervision (level two), collaborative supervision (level three), and full independence (level four). The definitions of the four autonomy levels are given below. As indicated, the higher the autonomy level, the lower the supervision requirement:
Level 1, Direct Supervision: The dental hygienist practice is mandated under the direct supervision of a dentist, with supervision requirements specified. A dentist has to be present when dental hygienist is performing the task.
Level 2, General Supervision: A dental hygienist practicing under the general supervision of a licensed dentist shall have a written agreement with the supervising dentist that clearly sets forth the terms and conditions under which the dental hygienist may practice. A dentist needs to authorize prior to services but need not be present.
Level 3, Collaborative Agreement: The hygienist may practice without supervision, pursuant to a collaborative agreement with a dentist. For example, a dental hygienist who has entered into a collaborative agreement may perform dental hygiene services on children, senior citizens age 65 and older, and persons with developmental disabilities in long-term care facilities, free clinics, hospitals, Head Start programs, residences of homebound patients, local health units, schools, community health centers, and state and county correctional institutions. The dental hygienist must have a written agreement with no more than one dentist.
Level 4, Full Independence: There is no requirement that a dentist must authorize or supervise most dental hygiene services. The dental hygienist is allowed to work without the supervision of a dentist.
The reason that we focus on the variation in supervision level of the DHPPI instead of the variation in permitted tasks incorporated into other components of the index is that each state has specific hygiene duties in the dental statutes that dictate the level of supervision required. Also, variation in permitted tasks is limited within a state. Generally, dental hygienists in states that grant a particular level of supervision may perform many other tasks with the same level of supervision. Thus, in practice, it is permitted autonomy that dictates SOP.
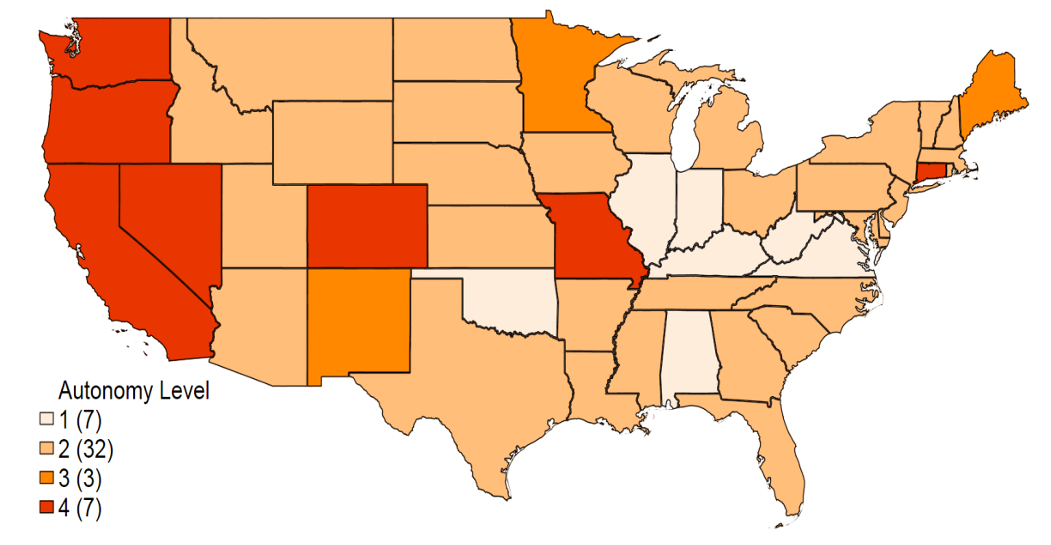
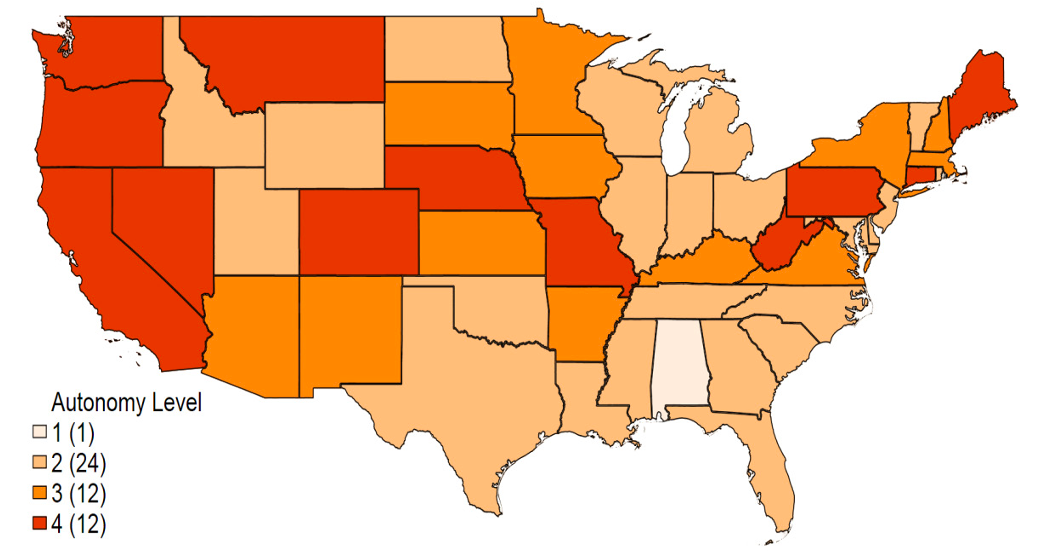
Dental supervision requirements may differ across practice settings, even if the same level of autonomy broadly applies to most practice settings within a state. These practice settings include private dental offices, long-term care facilities, schools, public health agencies, correctional facilities, and similar institutional facilities. In our analysis, we use changes in the highest autonomy level allowed among all the evaluated settings as our treatment variable. Figure 1 shows the changes between 2001 and 2014 in the highest autonomy level among all practice settings across states. During this time frame, the hygienist autonomy level increased in 19 states and remained unchanged in all other states. As of 2014 there were still 25 states that restricted dental hygienist autonomy to level 2 (general supervision) or lower.
Empirical Model and Data
Empirical Model
To assess the impact of regulatory changes on the outcomes of interest, we use a difference-in-differences approach in which we compare individuals in states that experienced a change in their SOP regulations for hygienists during the sample period to individuals in states that did not change their regulations. Our baseline estimating equation is as follows:
(1)
where represents the outcome of interest—dental care visits or expenditure—for individual
at year
;
is the treatment variable that indicates whether the autonomy level granted to dental hygien¬ists increased in state
at year
.
is a vector of individual-level control variables including age, race and ethnicity, marital status, urban residence, years of education completed before entering the survey, number of children under 5 or under 18 in the household, log of income earned by other family members (nor¬malized by household size), self-reported physical and mental health status, and a disability indicator.
is a vector of socioeconomic factors for county
in time
obtained from the Area Resource File, including real income per capita; the unemployment rate; the poverty rate; the percentage of the population with a college degree or higher at the county level; and the number of dentists, dental hygienists, and dental assistants per 10,000 total population at the state level. We also include variables from the Reimbursement component of DHPPI, including an indicator variable for whether direct reimbursement to hygienists is available from Medicaid and an indicator for whether direct payment is allowed from other third-party insurers or patients. These variables are intended to capture dental hygienists’ financial incentives. Finally,
and
are state fixed effects and year fixed effects, respectively, and
⋅
are state-specific linear trends. The latter capture the differential growth rate in dental care use and expenditure across states.
In order to account for the mass point at zero and right-skewness of the dental care utilization distribu- tion, we estimate separate models based on equation (1) using a binary outcome for any visits or expen- ditures (the extensive margin) and using a continuous outcome for the number of visits or amount of expenditure among the sample with positive values (the intensive margin). We specify the first model as a linear probability model (LPM):
(2)
where is a binary indicator that is equal to 1 if the individual has positive dental care use or expenditures, and 0 otherwise. The second model is a log-linear regression model that we apply to the sample with non-zero visits or expenditures:
(3)
Because the identifying variation in both models is within states over time, we cluster the standard errors of the coefficients and marginal effects at the state level (Cameron and Miller 2015).
Data and Outcome Variables
Our main data source is the 2001–2014 Medical Expenditure Panel Survey (MEPS), which is a nationally representative survey of the non-institutionalized population in the United States, containing detailed information on individuals’ health and dental care use and costs, as well as a large number of individual socioeconomic characteristics. We use observations in the Full Year Consolidated Data Files of the MEPS as a repeated cross-section to create a panel of states over time. The total number of observations in our sample is 489,278. We used geographic identifiers in the restricted-use version of the MEPS to link county- and state-level control variables and information on dental provider shortage areas.
In order to construct individual-level measures of dental care visits and expenditures, we use the MEPS dental event files, which contain information on procedure and provider type (e.g., general dentist, dental hygienist, or oral surgeon) for each visit. We categorize dental visits into those made to the following provider(s): general dentist (GD) only, dental hygienist (DH) only, or both a dentist and dental hygienist. Similarly, we group dental visits into the broad categories of preventive dental care (including dental examinations, teeth cleanings, X-rays, fluoride applications, and sealant applications) and dental treatment (including but not limited to root canals, fillings, inlays, crowns, gum surgeries, tooth extractions, implants, bridges, dentures, repairs, and whitening) as well as into the more specific individual categories reported in the event files. The MEPS dental procedure categories are consistent with procedure definitions in the DHPPI, with the exception of the DHPPI category of “placement of amalgam restorations,” which we map to the more general MEPS category, “dental fillings.” For dental expenditure, we construct measures of total dental care expenditure, out-of-pocket payments for dental care, and third-party payments.
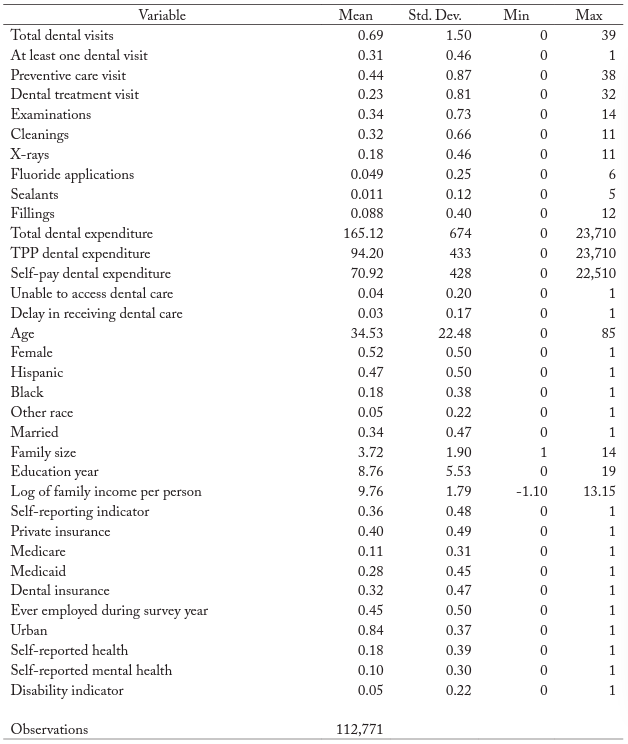
The MEPS also contains measures of individual perceptions of access to dental care. Respondents are asked, “Was {the person} unable to get (delayed in getting) necessary dental care?” Parents are asked about children aged 2–17, “Has a doctor or other health provider ever given you {or the person} advice about {him/her} having regular dental check-ups?” We use individual responses to these questions to construct three binary indicators of access to dental care: (1) whether the person was unable to receive necessary dental care, (2) whether the person was delayed in receiving necessary dental care, and (3) whether doc- tors ever advised the child to have a regular dental checkup. To this set of variables, we add a measure of the individual’s self-reported frequency of dental checkups; we code the response as 1 if the respondent reported the frequency as “less than once a year” or more, and 0 otherwise. Table 1 shows the summary statistics for all the outcome variables and the control variables.
Autonomy Levels and Sample Stratification
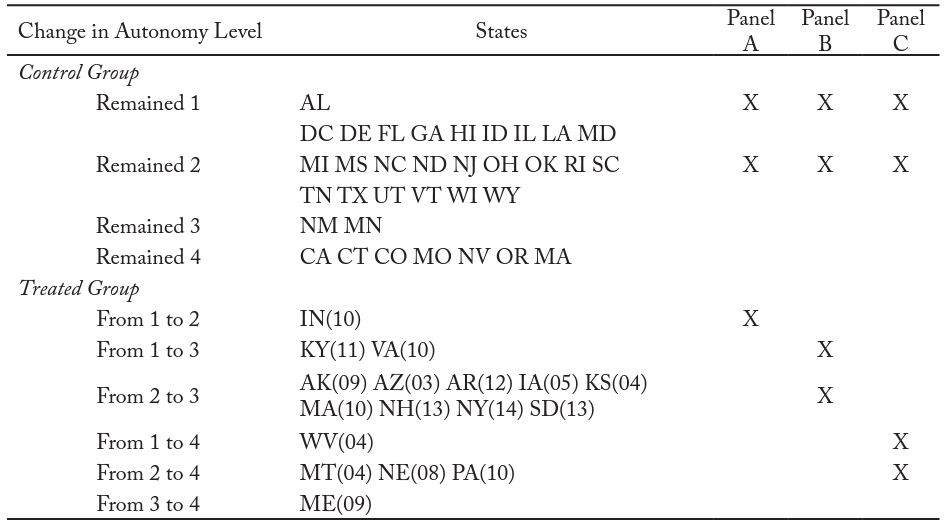
In order to use the difference-in-difference framework, we must compare individuals in states with a law change to those in the states without a law change. We categorize the SOP laws for dental hygienists using the regulatory variable measuring the highest level of autonomy allowed among all practice settings. We summarize the effective year of law change in the dental hygienist autonomy level for each state from 2001–2014 in table 2.8For states that changed supervision requirements, the law changed only once during the sample period. Columns (1) through (3) of table 2 summarize the changes across states while columns (4) through (6) specify the states used in each version of the model as either a treatment state or a control state. Because moving to different autonomy levels can potentially lead to heterogeneous effects on dental care access and use, we stratify the full sample based on the autonomy level that the state adopted. Also, to enable comparison across panels, we keep the same control group in each panel (i.e., individuals in the states where the DH autonomy level remained 1 or 2). Thus, the treatment group for each panel is (A) states where the dental hygienist autonomy increased from 1 to 2, (B) states where the hygienist autonomy increased from 1 to 3 or from 2 to 3, and (C) states where the hygienist autonomy increased from 1 to 4 or from 2 to 4.
Dental Professional Shortage Areas
We expect laws governing dental hygienist SOP to have the largest effect on access to dental care in areas with a shortage of dental care providers. The Department of Health and Human Services (DHHS) defines Health Professional Shortage Areas (HPSA) as counties with an insufficient number of health care providers. The definitions distinguish between counties where there is a shortage of providers in the entire county, or just in part of the county. We use the HPSA definitions that are specific to the number of dentists in each county and restrict our sample to households living in an HPSA with a shortage of dentists in the entire county. The designation of HPSA varies over time for many counties because the criteria used to determine HPSA status is based on the value of a provider density index relative to a cutoff. While the cutoff is relatively fixed, the value of the index fluctuates from year to year. In order to keep a consistent sample of HPSA counties, we include counties designated as full HPSAs in 2008 (the mid-point of our sample period) and follow this set of counties across our 2001–2014 sample period.
Main Results
This section contains estimates from our difference-in-differences models of the effect of dental hygienist autonomy on dental visits and expenditures. We estimate the models for individuals residing in health provider shortage areas using the three different panels specified in table 2. We estimate each marginal effect separately at the extensive margin (i.e., whether there were any visits or expenditures) and on the intensive margin (i.e., the number of visits or amount of expenditures conditional on having any).
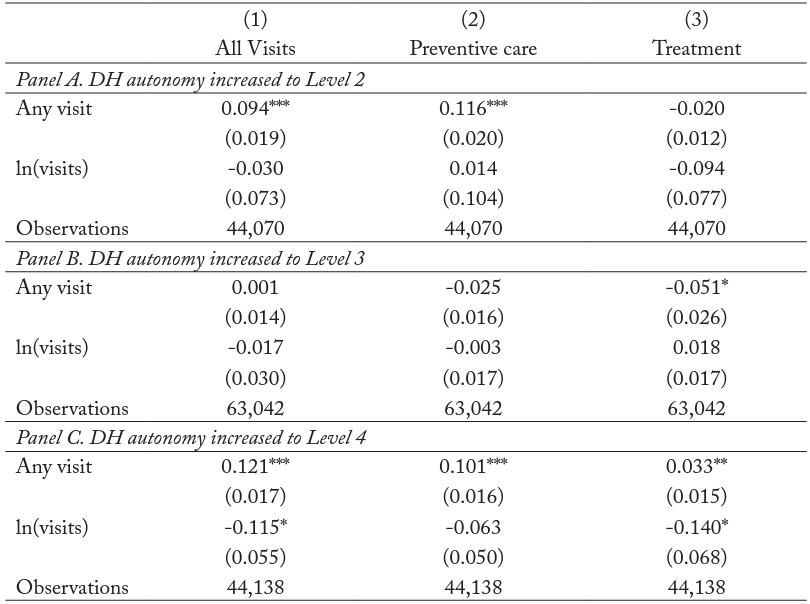
Table 3 contains estimates of the impact of changes in DH autonomy on total dental visits, preventive dental care visits, and dental treatment visits. The results in panel A indicate that moving from DH autonomy level 1 to level 2 leads to an increase in the probability of receiving any dental care by 9.4 percentage points, which is mainly driven by the increase in the probability of receiving any preventive care (by 12 percentage points). Likewise, an increase to DH autonomy level 4 (full independence) leads to a 12 percentage point (39 percent) increase in the probability of receiving any dental care (column 1 of panel C). However, in this case there is an associated increase in the probability of both preventive care and treatment visits. Full DH independence is also associated with an 11.5 percent reduction in the total number of dental visits. While this is the case for panels A and B as well, those marginal effects are not precisely estimated. The reduction in visits is mostly due to a statistically significant reduction in the need for treatment (column 1 of panel C). There is also a reduction in dental treatment when states increase their DH autonomy to level 3, but only at the extensive margin.
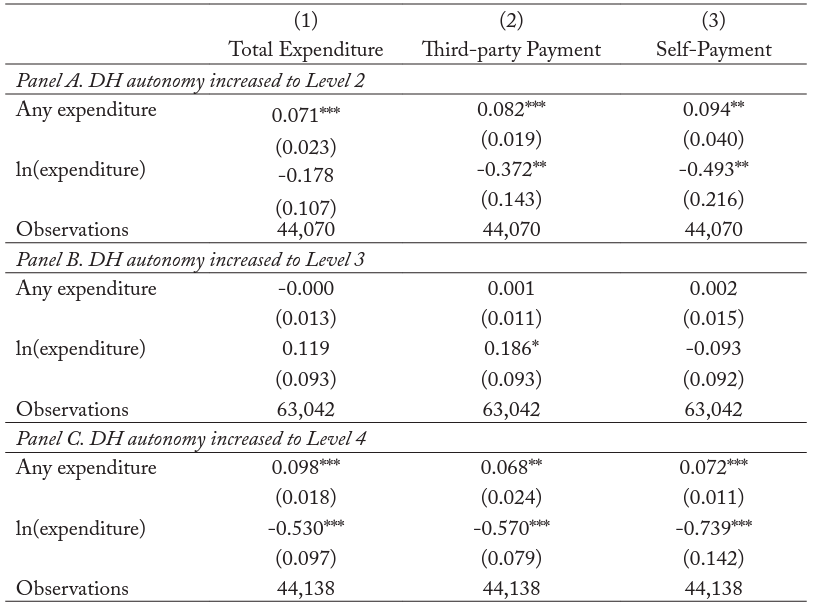
Table 4 shows the effect of DH autonomy on total annual dental expenditure as well as on third-party public and private payments and self-payments. Consistent with the results on dental care visits, the increases to DH autonomy levels 2 and 4, as shown in panels A and C, both lead to an increase in expenditure at the extensive margin ranging from 23 to 32 percent. More notable are the large decreases in expenditure among regular users of dental care (i.e., those with positive expenditure) of between 37 and 57 percent for third-party payments, and between 49 and 74 percent for out-of-pocket payments.
Discussion
Robustness Check
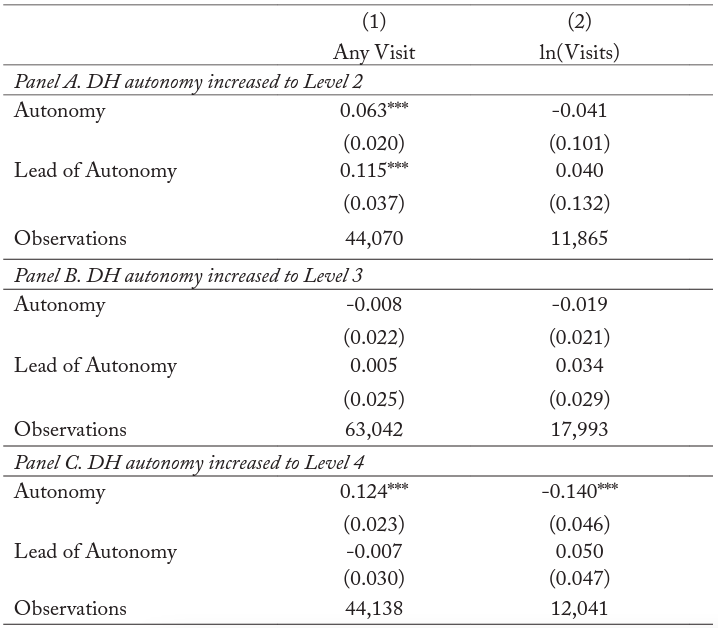
We examine whether pre-existing trends in dental care utilization may cause us to overestimate the effect of dental hygienist autonomy on dental care use and expenditure. To test for the presence of pre-existing trends, we estimate equation (1) after adding the lead of the regulatory indicator variable. A statistically significant coefficient on the lead is consistent with the presence of a pre-existing trend in the outcome variable. We estimate this specification using both an indicator for any dental visit and the log of the total number of dental visits on the conditional sample of dental care user. The results in table 5 show that the coefficients on the lead of the regulatory indicator variable are statistically insignificant in most cases, which is consistent with the parallel trend assumption of the difference-in-differences model. The one exception is column (1) of panel A, which suggests that estimates from the LPM of the extensive margin in panel A could be confounded by a pre-existing trend in the only treated state, Indiana.
Specific Dental Services
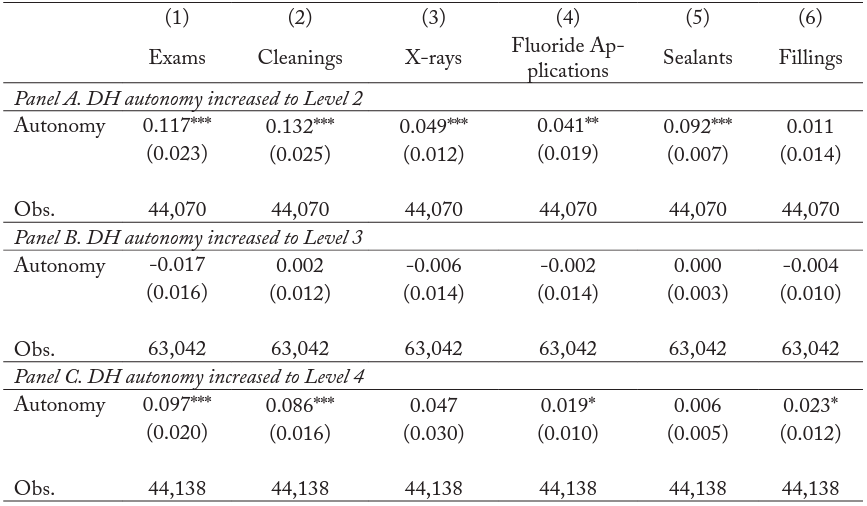
When states increase autonomy levels, hygienists are permitted to perform more preventive care services such as teeth cleanings, X-rays, and sealant applications, as well as a limited number of restorative services such as applications of amalgam fillings, with less supervision. Our main results indicate that higher autonomy is associated with an increase in preventive care, which is consistent with changes to the tasks hygienists are permitted to perform. In order to investigate this mechanism more directly, we estimate the effect of changes in DH autonomy on the likelihood that hygienists perform specific tasks using the linear probability model described in equation (2). The results, reported in table 6, indicate that moving from autonomy level 1 to 2 (panel A) is associated with increases in the likelihood that hygienists perform oral examinations, cleanings, X-rays, fluoride applications, and sealant applications. However, as noted in table 5, these estimates are only associational due to the potential for pre-existing trends in the outcomes. The estimates from panel C, in which states moved to autonomy level 4, indicate a 9.7 percentage point (40 percent) increase in the probability of dental examinations; an 8.6 percentage point (38 percent) increase in cleanings; a 1.9 percentage point increase in fluoride applications (47 percent); and a 2.3 percentage point increase (38 percent) in the application of fillings.
Access to Care
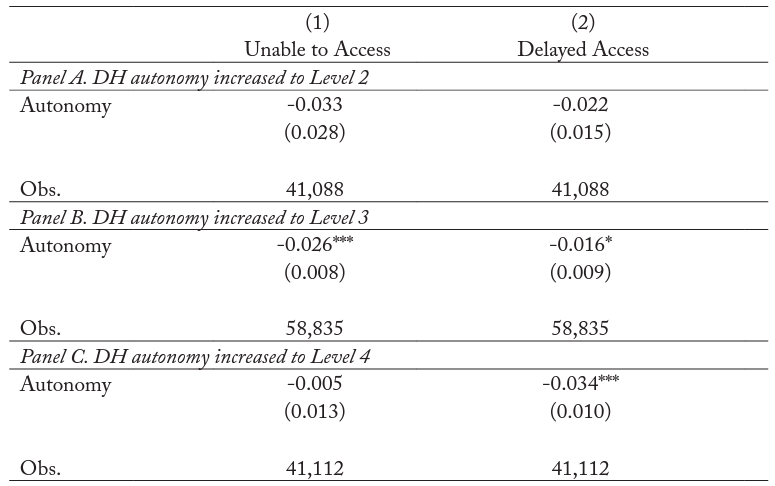
There are two primary mechanisms through which dental care use might be affected by more liberal dental hygienist SOP: lower input costs leading to lower dental care prices and greater availability of providers in underserved areas. We investigate the latter by re-estimating the linear probability model specified in equation (2) using patient responses to questions about the availability of necessary dental care as dependent variables. Specifically, we model “whether the person was unable to receive necessary dental care” and “whether the person was delayed in receiving necessary dental care.”9 These two questions were not asked in 2001.
The marginal effect of the autonomy treatment variable is negative in all models in table 7. This suggests that DH autonomy improves perceived access to dental care, although the estimates are only precisely estimated in panels B and C. In particular, an increase in DH autonomy to level 3 is associated with a reduction in both the probability of patients reporting that they were unable to receive dental care (down by 2.6 percentage points, or 65 percent) and the probability of patients reporting a delay in receiving dental care (down by 1.6 percentage points, or 53 percent). In addition, moving to DH full independence (level 4) is associated with a reduction of 3.4 percentage points in the probability of reporting a delay in receiving necessary dental care. Overall, these estimates suggest that greater DH autonomy is associated with better access to care.
Conclusion
In this paper, we study the effects of scope of practice (SOP) regulations for dental hygienists on dental care use and costs. We use a difference-in-differences approach based on past state expansions of the permitted autonomy levels of dental hygienists from 2001–2014. These autonomy levels correspond to direct supervision (lowest), general supervision, collaborative agreement, and full independence (highest). Focusing on the areas with a shortage of dental care providers, our results indicate that more individuals use dental care when hygienists have more autonomy, and particularly when states move from direct to general supervision or from direct or general supervision to full independence. Notably the most consistent increases in utilization are for preventive care services. In addition, we find that higher levels of autonomy are associated with a decrease in the intensity of treatment for regular users of dental care services. This occurs primarily through a reduction in treatment visits. Likewise, dental care expenditures are reduced for regular users of dental care when states move from direct or general supervision to full independence. This is consistent with previous studies that find greater use of preventive dental services is associated with a decline in the need for treatment and restorative care (Meyerhoefer, Panovska, and Manski 2016; Manski et al. 2014).
Previous estimates from Wing and Marier (2014) suggest that the probability of dental care use is not affected by the number of tasks dental hygienists are allowed to perform. However, this study did not consider supervision requirements. We find that removing the administrative burden of supervision from dentists and granting dental hygienists more autonomy increases dental care use, especially for preventive care, and lowers treatment costs. However, it is important to note that we focus our analysis on dental care provider shortage areas, whereas Wing and Marier (2014) consider all areas combined. When we estimate our models using the full sample, the estimates are much less precise, suggesting that changes in SOP laws may have a much smaller impact on the use of dental services in non-shortage areas.10Results available from the authors upon request.
In further analyses we find that the expansion of dental hygienist autonomy increases the likelihood that patients undergo many of the specific preventive dental tasks that dental hygienists are allowed to perform, including examinations, cleanings, X-rays, fluoride applications, and fillings (a restorative procedure). The magnitude of these increases in use is large, ranging from 38 to 47 percent in some cases. Given that the cost-effectiveness of preventive care is higher than dental treatment, our results suggest increasing DH autonomy could reduce barriers associated with the provision of basic dental services, thereby promoting more efficient dental care delivery (Quinonez et al. 2005; Lee et al. 2006; Children’s Dental Health Project 2013). Our analysis on qualitative measures of access to dental care is consistent with better access after supervision requirements are lessened. Our findings have policy relevance because they suggest that relaxing supervision requirements in areas with shortages of dental care providers could mitigate access problems and increase preventive care while reducing future treatment costs.
Our study has several limitations that should be noted. First, the MEPS does not contain information on the quality of care received during dental visits. As a result, we are not able to directly examine how SOP laws for dental hygienists affect the quality of dental care. In addition, models of the extensive margin of use when states increase from direct to general supervision could be confounded by pre-treatment trends in the outcomes. Finally, we do not have information on the hours worked by dental providers. Therefore, we are unable to directly estimate labor substitution effects. Future research using information on providers’ service hours at the practice level could shed light on the change in labor supply between dental hygienists and dentists after the expansion of scope of practice for dental hygienists.
Appendix
Figure 1. Dental Hygienist Autonomy Level by State in 2001 and 2014
Figure 1a. Dental Hygienist Autonomy Level by State in 2001
Figure 1b. Dental Hygienist Autonomy Level by State in 2014
Notes: Data were collected by authors from state statutes and regulations, and cross-referenced with advocacy files at the American Dental Hygienists’ Association.
Table 1. Summary Statistics
Note: All means are calculated using the MEPS sampling weights.
Table 2. Changes in Highest Autonomy Level Allowed for DH during Period 2001–2014
Notes: Number in parentheses is the year (20XX) that the state implemented the change in autonomy level listed at left. Autonomy levels correspond to direct supervision (lowest), general supervision, collaborative agreement, and full independence (highest). Data were collected by the authors from state statutes and regulations, cross-referenced with advocacy files at the website of the American Dental Hygienists’ Association.
Table 3. Estimates of Effect of Dental Hygienist Autonomy Level on Dental Care Visits
Notes: Level of significance: ***<0.01, **<0.05, *<0.1. For each type of visit, we estimate a two-part model wherein the first part is a linear probability model (LPM) using an indicator of any visit and the second part is a log-linear regression for individuals who have any visit. All models include state and year fixed effects and state-specific linear trends. Standard errors in parentheses are clustered at the state level.
Table 4. Estimates of Effect of Dental Hygienist Autonomy Level on Dental Care Expenditure
Notes: Level of significance: ***<0.01, **<0.05, *<0.1. For each type of expenditure, we estimate a two-part model wherein the first part is a linear probability model (LPM) using an indicator of any expenditure and the second part is a log-linear regression for individuals with any expenditure. All models include state and year fixed effects and state-specific linear trends. Standard errors in parentheses are clustered at the state level.
Table 5. Specification Test of Parallel Trend Assumption for Effect of DH Autonomy on Total Dental Visits
Notes: Level of significance: ***<0.01, **<0.05, *<0.1. Column (1) estimates a linear probability model (LPM) using an indicator of any visit. Column (2) estimates a log-linear regression for individuals with any visit. All models include state and year fixed effects and state-specific linear trends. Standard errors in parentheses are clustered at the state level.
Table 6. Effect of Dental Hygienist Autonomy Level on Specific Dental Tasks
Notes: Level of significance: ***<0.01, **<0.05, *<0.1. For each type of visit, we report the marginal effect from the linear probability model using an indicator of any visit. All models include state and year fixed effects and state-specific linear trends. Standard errors in parentheses are clustered at the state level.
Table 7. Effect of Dental Hygienist Autonomy Level on Access to Dental Care
Notes: Level of significance: ***<0.01, **<0.05, *<0.1. All cells estimate linear probability model (LPM) and reported coefficients are average marginal effects. All regressions include state and year fixed effects and state-specific linear trends. Standard errors in parentheses are clustered at the state level.
References
Cameron, Colin A., and Douglas L. Miller. 2015. “A Practitioner’s Guide to Cluster-Robust Inference.” Journal of Human Resources 50 (2): 317–72.
Children’s Dental Health Project. 2013. “Issue Brief: Cost Effectiveness of Preventive Dental Services.” Updated by Adam Lincoln and Shanté Alerté from materials developed by Shelly-Ann Sinclair and Burton Edelstein. April 2013. https://www.cdhp.org/resources/163-cost-effectiveness-of-preventive-dental-services.
Kleiner, Morris M. 2016. “Battling over Jobs: Occupational Licensing in Health Care.” American Economic Review 106 (5): 165–70.
Kleiner, Morris M., and Alan B. Krueger. 2013. “Analyzing the Extent and Influence of Occupational Licensing on the Labor Market.” Journal of Labor Economics 31 (S1): S173–202.
Kleiner, Morris M., and Robert T. Kudrle. 2000. “Does Regulation Affect Economic Outcomes? The Case of Dentistry.” Journal of Law and Economics 43 (October): 547–82.
Kleiner, Morris M., Allison Marier, Kyoung Won Park, and Coady Wing. 2016. “Relaxing Occupational Licensing Requirements: Analyzing Wages and Prices for a Medical Service.” Journal of Law and Economics 59 (May): 1–42.
Kleiner, Morris M., and Kyoung Won Park. 2010. “Battles among Licensed Occupations: Analyzing Gov- ernment Regulations on Labor Market Outcomes for Dentists and Hygienists.” NBER Working Paper No. 16560. National Bureau of Economic Research, Cambridge, MA.
Koppelman, Jane, Kelly Vitzthum, and Lisa Simon. 2016. “Expanding Where Dental Therapists Can Practice Could Increase Americans’ Access to Cost-Efficient Care.” Health Affairs 35 (12): 2200–06.
Langelier, Margaret, Tracey Continelli, Jean Moore, Bridget Baker, and Simona Surdu. 2016. “Expand- ed Scopes of Practice for Dental Hygienists Associated with Improved Oral Health Outcomes for Adults.” Health Affairs 35 (12): 2207–15.
Lee, Jessica Y., Thomas J. Bouwens, Matthew F. Savage, and William F. Vann Jr. 2006. “Examining the Cost-effectiveness of Early Dental Visits.” Pediatric Dentistry 28 (2): 102–105.
Manski, Richard J., Diane Hoffmann, and Virginia Rowthorn. 2015. “Increasing Access to Dental and Medical Care by Allowing Greater Flexibility in Scope of Practice.” American Journal of Public Health 105 (9): 1755–62.
Manski, Richard J., Mark D. Macek, Erwin Brown, Kelly V. Carper, Leonard A. Cohen, and Clemencia Vargas. 2014. “Dental Service Mix among Working-age Adults in the United States, 1999 and 2009.” Journal of Public Health Dentistry 74 (2): 102–09.
Markowitz, Sara, E. Kathleen Adams, Mary Jane Lewitt, and Anne L. Dunlop. 2017. “Competitive Ef- fects of Scope of Practice Restrictions: Public Health or Public Harm?” Journal of Health Economics 55:201–18.
McMichael, Benjamin J. 2018. “Beyond Physicians: The Effect of Licensing and Liability Laws on the Supply of Nurse Practitioners and Physician Assistants.” Journal of Empirical Legal Studies 15 (4): 732–71.
Mertz, Elizabeth A. 2016. “The Dental-Medical Divide.” Health Affairs 35 (12): 2168–75.
Meyerhoefer, Chad D., Irina Panovska, and Richard J. Manski. 2016. “Projections of Dental Care Use through 2026: Preventive Care to Increase While Treatment Will Decline.” Health Affairs 35 (12): 2183–89.
Negrusa, Brighita, Paul F. Hogan, John T. Warner, Caryl H. Schroeder, and Bo Pang. 2016. “Scope of Practice Laws and Anesthesia Complications: No Measurable Impact of Certified Registered Nurse Anesthetist Expanded Scope of Practice on Anesthesia-Related Complications.” Medical Care 54 (10): 913–20.
Oral Health Workforce Research Center. 2016. “A Dental Hygiene Professional Practice Index by State, 2014.” http://www.healthworkforceta.org/research-alert/dental-hygiene-professional-practice-in- dex-by-state-2014/.
Picard, Alyssa. 2009. “Making the American mouth: Dentists and public health in the twentieth century.” Rutgers University Press.
Perry, John J. 2009. “The Rise and Impact of Nurse Practitioners and Physician Assistants on Their Own and Cross-Occupation Incomes.” Contemporary Economic Policy 27 (4): 491–511.
Quinonez, Rocio B., Stephen M. Downs, Dan Shugars, John Christensen, and William F. Vann Jr. 2005. “Assessing Cost-effectiveness of Sealant Placement in Children.” Journal of Public Health Dentistry 65 (2): 82–89.
Reinders, Jan J., Wim P. Krijnen, Pieter Onclin, Cees P. van der Schans, and Boudewijn Stegenga. 2017. “Attitudes among Dentists and Dental Hygienists towards Extended Scope and Independent Prac- tice of Dental Hygienists.” International Dental Journal 67 (1): 46–58.
Timmons, Edward, Jason Hockenberry, and Christine Durrance. 2016. “More Battles among Licensed Occupations: Estimating the Effects of Scope of Practice and Direct Access on the Chiropractic, Physical Therapist, and Physician Labor Market.” Mercatus Research. Mercatus Center at George Mason University, Arlington, VA.
Timmons, Edward Joseph. 2017. “The Effects of Expanded Nurse Practitioner and Physician Assistant Scope of Practice on the Cost of Medicaid Patient Care.” Health Policy 121 (2): 189–96.
Traczynski, Jeffrey, and Victoria Udalova. 2018. “Nurse Practitioner Independence, Health Care Utilization, and Health Outcomes.” Journal of Health Economics 58:90–109.
Wanchek, Tanya. 2010. “Dental Hygiene Regulation and Access to Oral Healthcare: Assessing the Variation across the US States.” British Journal of Industrial Relations 48 (4): 706–25.
Wing, Coady, and Allison Marier. 2014. “Effects of Occupational Regulations on the Cost of Dental Services: Evidence from Dental Insurance Claims.” Journal of Health Economics 34 (1): 131–43.
Wing, Paul, Margaret Langelier, Tracey Continelli, and Ann Battrell. 2005. “A Dental Hygiene Professional Practice Index (DHPPI) and Access to Oral Health Status and Service Use in the United States.” Journal of Dental Hygiene 79 (2): 10.


