
 SoundCloud
Introduction
The advent of car-sharing platforms has expanded the peer-to-peer car sharing market, but because they are so new, policymakers have yet to decide where they fit in tax policy. As of this paper, no state policymakers have decided that the state’s peer-to-peer car sharing tax policy should be identical to the existing car rental tax policy. While some analysts have considered the implications of different policies, many questions cannot be resolved without an empirical analysis.1For an in-depth analysis on car sharing tax policy, see Garrett Watson, “Modernizing Rental Car and Peer-to-Peer Car Sharing Taxes for a Post-Pandemic Future,” Tax Foundation, April 22, 2021 This paper provides the first empirical evidence of car sharing on issues relevant to tax policy.
The empirical evidence comes from transaction-level data provided by Turo, the world’s largest car sharing platform. The data includes detailed information on over 1.5 million transactions in eight states and Washington D.C. Transactions are then linked to demographic information from the Census.
The demographic information provides important evidence on who uses car sharing platforms. Although guests are more likely to come from high-income neighborhoods, the share of guests from low-income neighborhoods is not trivial. Furthermore, a significant portion of guests come from more diverse neighborhoods. The demographic details are important for understanding the social justice implications of tax policy.
This analysis examines who would bear the burden of a tax on peer-to-peer car sharing. Policymakers frequently look at taxes on car rentals as an opportunity to raise revenue without harming residents. The argument is that the primary customers of car rental companies are non-residents visiting the area. But many residents rent cars to satisfy short- and long-term needs. The question, then, is when governments tax car sharing, how much of the incidence of the tax falls on residents. While tax incidence is a common theoretical consideration, this is fundamentally an empirical question. The transaction data show that, regardless of how the burden is shared between guests and hosts, so many residents participate in the market that the tax burden would overwhelmingly fall on residents.
This piece concludes with insights on who bears the deadweight loss from taxing such transactions. Although one function of taxes is to raise revenue, another function is to discourage some activities. These discouraged transactions are called deadweight loss—the economic activity that would have occurred in a world without the tax. The transactions most likely to be discouraged are the ones where guests are more sensitive to prices. This analysis shows that resident guests are more sensitive to prices than the average guest. Thus, not only do residents bear a disproportionate share of the tax burden, they bear more of the burden of deadweight loss.
Data
The data are provided by agreement with Turo. Turo is the world’s largest car sharing platform. It enables a car owner (“host”) to list her car’s availability for renters (“guests”). The platform is decentralized, the host has the choice to set her own price (though whether the car is used will depend on supply and demand), and most hosts are private parties listing a car when it has spare capacity. The proprietary Turo data consist of transaction-level information for all cars shared on the platform in eight states (California, Florida, Texas, Nevada, Arizona, Virginia, Maryland, Utah) and Washington D.C. For these markets, the data includes every transaction from January 1, 2018 through October 31, 2020 (over 1.5 million transactions).
The transaction-level data provide key information about the transaction and the guest. Across the eight states and D.C. there are 83 markets. For each transaction, the gross revenue is observed, which includes not just the booking rate but also fees and add-ons, such as pre-paying for gas or including items such as a picnic basket or surf board (the add-ons are unobserved).
The data also includes the guest billing ZIP code, which allows for classification of whether the transaction is in-market, in-state, or out-of-state. Furthermore, as explained below, the guest billing ZIP code allows for matching of each transaction to some demographic information from the Census.
Guest Demographics
Understanding who uses car-sharing platforms is important for understanding broader issues of social justice and who would pay a tax. For instance, excise taxes are understood to be regressive because as income decreases the percentage of your income paid in taxes increases, but if excise taxes are placed on goods or services that are disproportionately used by low-income households, then the regressivity is magnified. Similarly, we might be concerned about the racial incidence of an excise tax. This analysis explores these demographic issues.
Although the data do not provide access to the guest’s personal demographic data, it does provide the billing ZIP code for guests in the U.S. Using Census data, guests’ ZIP codes are matched to their ZIP Code Tabulation Areas (ZCTA), which are generalized representations of the ZIP codes that are associated with census blocks. From here, we can look at Census demographic data.
The reader should note two details. First, none of the demographic analysis considers foreign guests (who account for 6% of transactions and 9% of revenue). Second, all subsequent demographic data is based on the guest’s billing ZIP code, not her personal information. Thus, all conclusions are subject to variation caused by who in that ZIP code chooses to use Turo. Nevertheless, the broad picture should be consistent.
Income Distribution of Guests
This analysis begins by examining the income distribution of guests. Figure 1 shows the four quartiles of the ZCTA median income distribution, accounting for the number of households in each ZCTA. Guests from the lowest income quartile accounted for 17% of Turo’s revenues from U.S. guests, and the bottom two quartiles together accounted for 35% of total revenues.
One concern about looking at the income distribution like this is that the data contain only transactions from eight states and Washington D.C., which means it overrepresents travelers and under-represents residents. For example, we cannot observe someone from Missouri booking a car in Missouri. If travelers are more likely to come from high-income ZCTAs (which is likely because travel is a normal good) then we should be concerned that the observed income distribution is skewed. This analysis aims to correct for this by only looking at in-state guests (for example, guests from California booking cars in California). Figure 1 reports the income distribution for this sub-sample and it is almost identical to the distribution for all guests. This could be because the states in the sample have more of the country’s high-income ZCTAs.
Figure 1. Income distribution of Turo guests, based on ZIP Code Tabulation Area
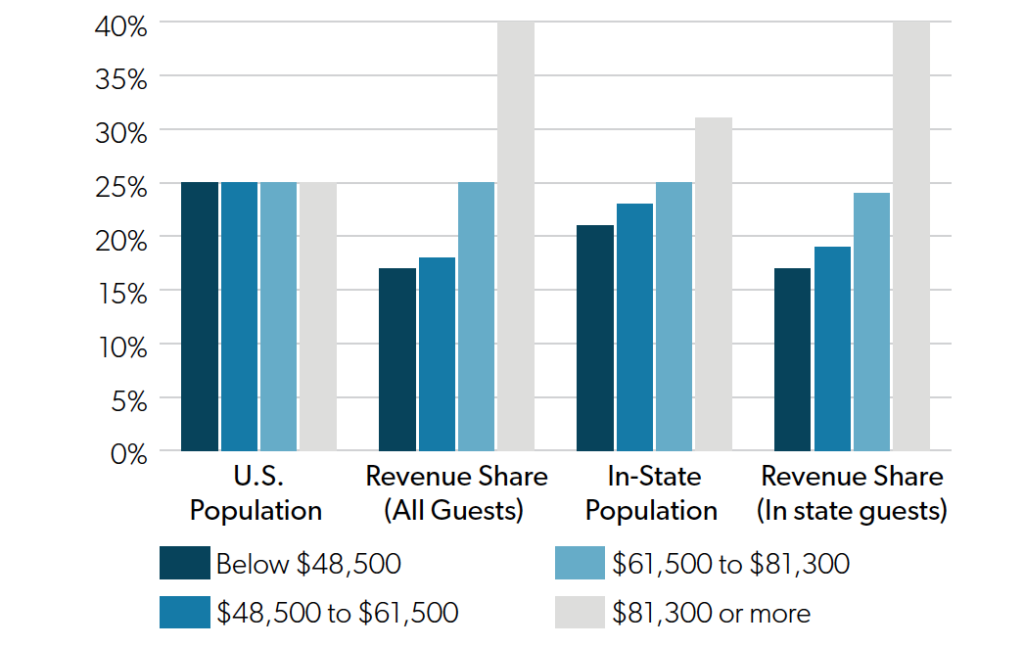
See Table 1 for data.
Racial Distribution of Guests
Next, we want to look at the racial distribution of guests. Similar to the income distribution, the data do not report personal information about guests, so the best option is to look at the racial distribution of the guests’ billing ZCTA. Unlike income, race is not a one-dimensional trait, which makes it hard to group the ZCTAs. To simplify, ZCTAs are grouped based on the percentage of the population that is white (non-Hispanic). As a reminder, all demographic distributions apply only to guests who live in the U.S.
Figure 2 shows the proxy for the racial distribution of guests. While only 33% of the US population lives in ZCTAs where whites are less than 50% of the population, 49% of revenues come from these ZCTAs. Furthermore, although 39% of the population lives in ZCTAs that are more than 75% white, these neighborhoods only account for 19% of Turo’s revenue. These distributions show that Turo is disproportionately used by guests from minority neighborhoods.
As mentioned with the income distribution, the sample of transactions misrepresents the national distribution because it only includes transactions from eight states and D.C. The racial distribution of the U.S. and the racial distribution of these states are not the same. Moreover, we observe travelers from other states but not the behavior for those who rent within the state. To get a different perspective on the racial distribution of guests, we can look at the racial distribution of in-state guests.
Figure 2 shows that these states are more racially diverse than the rest of the U.S. In the U.S. population, 39% of people live in ZCTAs that are more than 75% white, but in these states only 16% of people live in these ZCTAs. When compared to the states’ racial distributions, we see minority neighborhoods provide an even greater share of the revenue. Minority neighborhoods (i.e. ZCTAs that are less than 50% white) generate 62% of revenue from in-state guests, even though only 52% of people in these states live there.
The numbers in Figure 2 are averages for the whole sample; Table 3 shows the variation across states. In Arizona, California, and Utah, the share of revenues coming from more diverse ZCTAs is equal to or less than the share of the population living in these neighborhoods. And in DC and Texas, the revenue share is only slightly higher than the population shares. But in Florida, Maryland, Nevada, and Virginia, the revenue share far exceeds the population share.
As with the income distribution, the figures presented are informative but detached from value judgments. The current data do not provide enough information to discern why more diverse neighborhoods are overrepresented in revenues. One could speculate that such neighborhoods may have less access to public transit or that households from these neighborhoods are less likely to own a car or more likely to need a short-term replacement for a car. But such questions are not only beyond the scope of this paper, they require collecting more data from guests. Policymakers interested in the racial distribution of who pays a potential tax should further investigate these patterns.
Figure 2. Racial distribution of Turo guests’ ZIP Code Tabulation Area
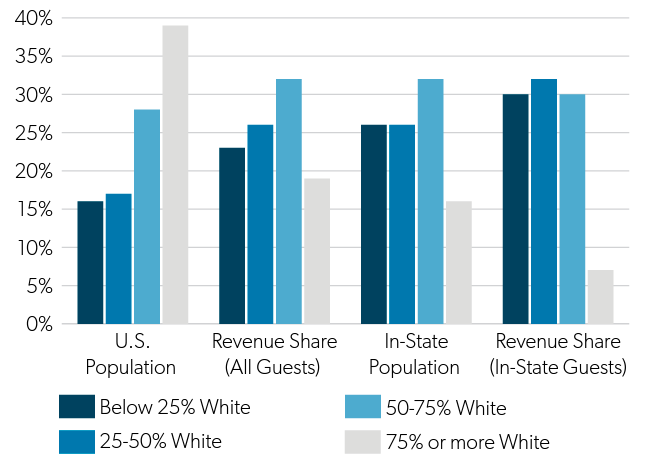
See Table 2 for data.
Tax Incidence
Having established some demographic characteristics of Turo guests, we can now investigate the issue of tax incidence. Remember, policymakers often see car rental taxes as an opportunity to collect tax revenue from non-residents. The extent to which their policy goals can be fulfilled depend on two factors: (1) what share of the guests are residents and (2) how much of the tax falls on guests. The first is an empirical issue, which this analysis explores in-depth. The second is also empirical, but cannot be answered with the data provided. However, I will show that because of the unique arrangement of peer-to-peer rentals, the share of the tax paid by guests is a minor issue in determining how much revenue is raised from non-residents.
First, let’s assume that policymakers are correct and that the guest pays 100% of the tax, meaning that the tax is a pass-through from the company to the guest. This is an unreasonable assumption, as will be explained below, but it provides a starting point. The question when pondering a new tax, then, is how much revenue and how many transactions come from residents.
Table 4 provides information on how many transactions come from residents; that is, customers booking a car in the same state (or, for D.C., district) as they live. Across all regions, residents account for 44% of car-sharing revenue. This share varies by market: in Utah, residents account for only 22% of revenues, but in Maryland and Texas, residents account for about 58% of revenues. Thus, if we maintain the unrealistic assumption that 100% of the tax is paid by the guest, a significant share of that tax revenue would come from residents, and in some markets, residents would pay a majority.
But it is unreasonable to assume that the guest pays the full tax. A classic result in economics is that the party that is charged a tax is not necessarily the party that bears the burden. Suppose that before the tax is implemented, a car share is $100.00 per day and the state taxes the guest 10% of the sales price. If the guest pays all of the tax, then the final price is $110.00. But higher prices will discourage some guests from renting, which decreases the rental company’s total revenue. To retain guests, the company might re- duce its prices to $95.00. The sales tax is $9.50, so the final price is $104.50. Only $4.50 of that tax comes from the guest paying more. The other $5.00 came from the company. Thus, although the tax targeted the customer, a portion of the tax fell on the company because the company needs to retain guests. The study of tax incidence is the study of how much of a tax falls on each party. In this example, the guest paid 47% of the tax, and the company paid the other 53%. So even though the tax targeted the customer, the company paid more of the tax than the guests.
In a traditional car rental tax, policymakers might not care that guests and companies share the incidence. Many car rental companies are not local businesses but instead are large, multi-state and multi-national corporations. But for peer-to-peer car sharing platforms like Turo, this is not the case. These platforms allow local car owners to list their cars to be shared. Thus, each transaction has two parties: the guest and the host. And while the guest is a resident only some of the time, the host is always a resident.
Accounting for the host changes how we account for how many transactions involve residents. When we look at only the guests, 49% of transactions come from residents. But when we consider that each transaction has two sides, and one side is always a resident, then the proportion of transactions involving residents increases to 75%. This percentage is fairly constant across states.
One concern with these results is that residents might be over-represented in the data because of the COVID-19 pandemic. With restricted travel, transactions in 2020 were missing many tourists. Almost by definition the transactions in 2020 had to come from residents. Thus, using 2020 data might bias any inferences about policy. To account for this, Table 4 also reports the figures restricting the data to 2018 and 2019. As expected, the residents’ share decreases, but the change is marginal. The main results are unaltered.
Residents are much more prevalent in a car-sharing platform than they are in the traditional rental car market. Thus, the incidence of the tax burden is a second-order problem relative to the number of residents involved in the market.
Resident Price Sensitivity
The tax burden is not the only relevant detail under consideration. Because taxes raise prices, they will discourage some guests, specifically the guests who are more sensitive to prices. Therefore, policymakers might be interested in the price sensitivity of residents and whether they are more likely to be pushed out of the market.
The evidence from Table 4 suggests that residents might be more price sensitive than the average guest. Residents account for 49% of all transactions, and if they had the same consumption patterns as the average guest then they would also account for 49% of revenues. But they only account for 44% of revenue, which means they must select cheaper options than the average guest. This section explores this pattern.
First, this analysis confirms that residents select cheaper transaction rates. While the patterns in Table 4 seem to indicate this behavior, it could be that the high share of resident guests are also coming from cheaper markets. To control for this factor, I run a regression analysis which controls for the reservation market. Looking at transactions that happen in the same market, residents generate 27% less per transaction than nonresidents.
To understand why residents generate less revenue, the two factors that contribute to the total revenue of a transaction are examined: the number of transaction days and the price per transaction day. About one third of the lower revenue can be attributed to residents having fewer transaction days. Transaction days are the total number of 24-hour periods that vehicles were shared, with any partial period counted as one transaction day. Thus, a transaction that started at 12:00 p.m. on Thursday and was returned at any time on Friday, either 11:59 a.m. or 11:59 p.m., would be two transaction days. The difference between residents and non-residents is not large, with non-residents using cars for 5.07 transaction days on average and residents 4.87, but it is enough of a discrepancy to significantly affect the total revenues. The other two-thirds of the lower revenues can be explained by residents selecting cars with lower prices.
There are two consumption patterns that explain residents getting lower prices. First, residents tend to choose lower-quality cars. Turo offers a wide variety of vehicles, so a guest in San Francisco might choose between renting a Honda Civic or a Tesla Model S. Using the market price of a car (obtained from used-car valuations sites Edmunds and Nada Guides) as a measure of car quality, residents choose cars with retail prices that are on average 8.5% lower than non-residents. But the choice of car is not the only reason prices are lower. When we look at the same car booked by residents and nonresidents, residents pay 11% less. One reason for this lower price is that residents are 5% less likely to book a car on the weekend, when prices are typically higher.
The combined evidence shows that resident guests are more sensitive to prices, which is important when considering tax policy. As taxes increase the price of the car sharing transaction, the higher prices push the more sensitive customers out of the market. On the one hand, this means that policymakers who assume that the tax revenue comes from non-resident guests have at least some justification, since they are less sensitive to price changes (though this ignores the above point that non-resident guests are a small proportion of the market). But on the other hand, this means that the tax’s deadweight loss disproportionately falls on residents.
Conclusion
The goal of this paper has been to explore the empirical evidence behind a potential tax on peer-to-peer car sharing platforms. A key caveat of this analysis is that it contains no value judgments. That is, it is up to policymakers to decide whether the evidence is in favor or against specific tax policies.
The demographic data on the income and racial distribution of guests is important, but equally important are the data we do not have. While we can get an idea of the income distribution of guests, the data provided by Turo does not have enough information to tell us about the income distribution of hosts. As discussed above, this side is important to understand because they also shoulder some of a tax’s burden. We can speculate that hosts are likely higher in the income distribution because they have the resources to purchase a car and list it on Turo. But the income from Turo might be what enables low-income households to afford a car. Similarly, we have little evidence to bear on the racial demographics of hosts. These remain empirical questions, and we should not be hasty to assume anything about hosts. Before implementing a tax, policymakers interested in the progressivity or social justice implications of a tax should investigate the demographics of hosts.
In a similar vein, this paper’s biggest contribution has been to reveal the significant role of residents in the peer-to-peer car sharing market. Residents are not only a significant share of guests, they constitute the entire host side of the market. Thus, policymakers cannot justify a tax on peer-to-peer car sharing with an assumption that the burden mostly falls on non-resident guests. That does not mean that policymakers cannot justify a tax for other reasons, just that they cannot convince their constituents that this is a free lunch.
Tables
Table 1. Income distribution of Turo guests, based on ZIP Code Tabulation Area
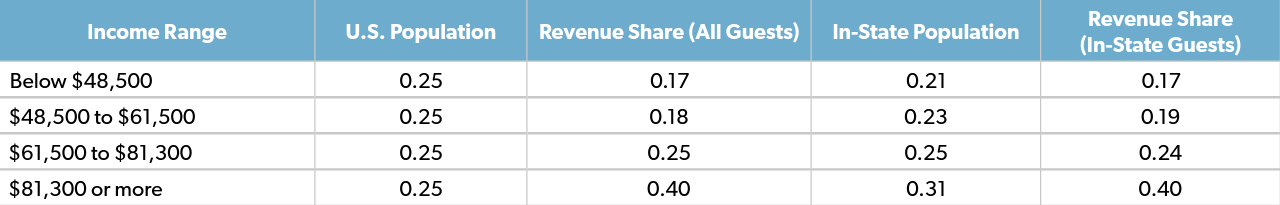
Notes: Income figures refer to the median income of the ZIP Code Tabulation Area.
Table 2. Racial distribution of Turo guests’ ZIP Code Tabulation Area
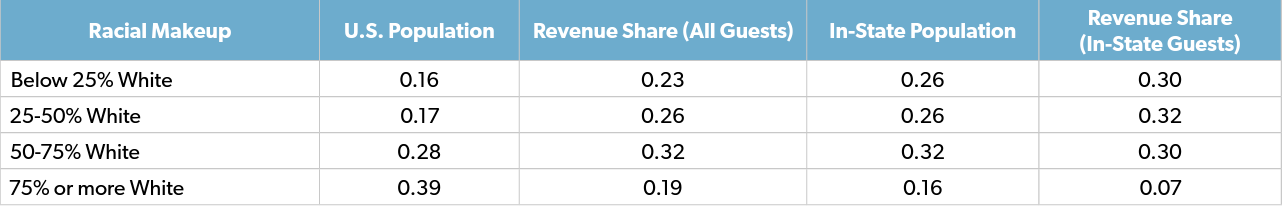
Notes: White means the population that primarily identifies as non-Hispanic White.
Table 3. The fraction of the states’ populations and Turo revenues that come from high-diversity ZCTAs
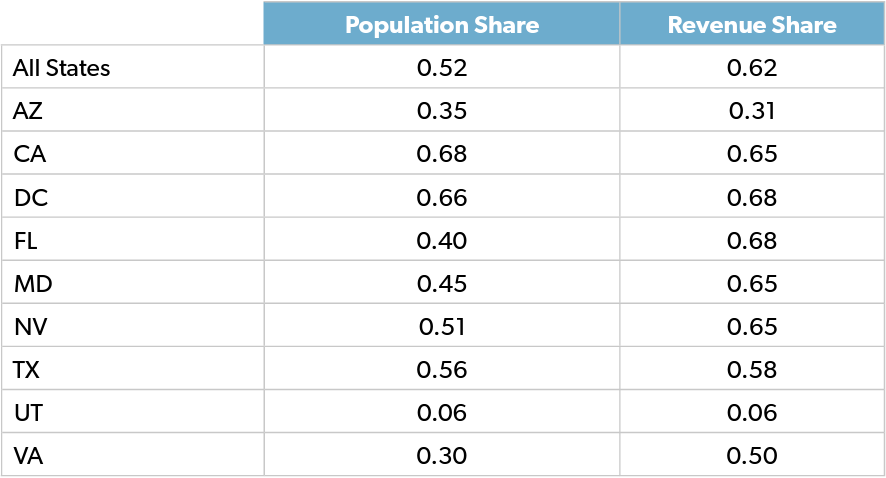
Notes: A high-diversity ZCTA is one where non-Hispanic Whites are less than 50% of the population.
Table 4. The share of revenue and transactions that come from residents
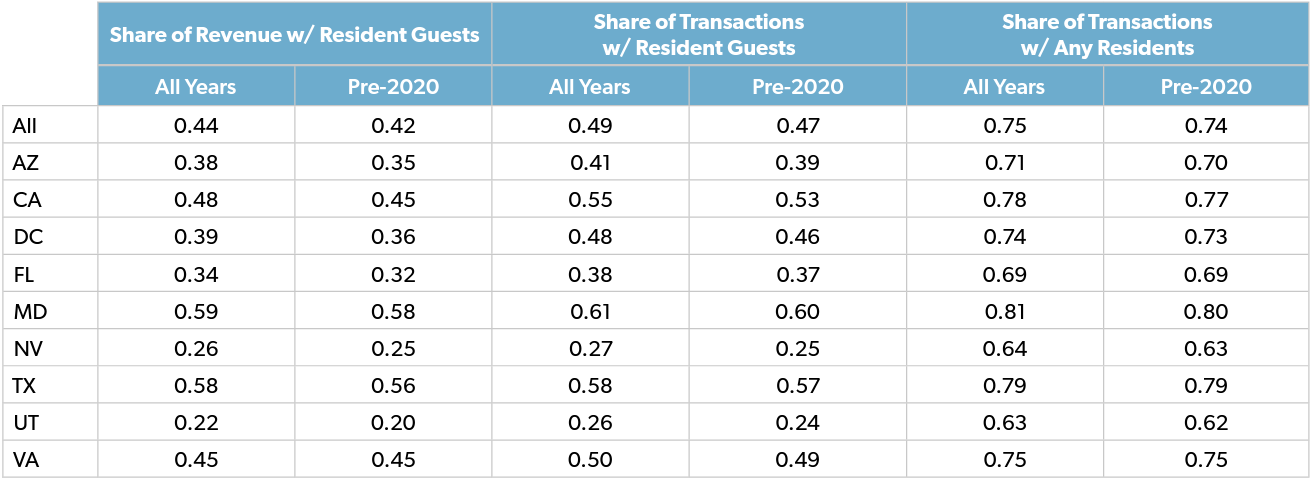
Note: The column that refers to transactions with any residents assumes two parties to each transaction (host and guest) and that all hosts are residents.